Tracing Amazon Bedrock with MLflow
MLflow supports automatic tracing for Amazon Bedrock, a fully managed service on AWS that provides high-performing
foundations from leading AI provides such as Anthropic, Cohere, Meta, Mistral AI, and more. By enabling auto tracing
for Amazon Bedrock by calling the mlflow.bedrock.autolog function, MLflow will capture traces for LLM invocation
and log them to the active MLflow Experiment.
MLflow trace automatically captures the following information about Amazon Bedrock calls:
- Prompts and completion responses
- Latencies
- Model name
- Additional metadata such as temperature, max_tokens, if specified.
- Function calling if returned in the response
- Any exception if raised
On serverless compute clusters, autologging is not automatically enabled. You must explicitly call mlflow.bedrock.autolog() to enable automatic tracing for this integration.
Prerequisites
To use MLflow Tracing with Amazon Bedrock, you need to install MLflow and the AWS SDK for Python (Boto3).
- Development
- Production
For development environments, install the full MLflow package with Databricks extras and boto3:
pip install --upgrade "mlflow[databricks]>=3.1" boto3
The full mlflow[databricks] package includes all features for local development and experimentation on Databricks.
For production deployments, install mlflow-tracing and boto3:
pip install --upgrade mlflow-tracing boto3
The mlflow-tracing package is optimized for production use.
MLflow 3 is highly recommended for the best tracing experience with Amazon Bedrock.
Before running the examples below, you'll need to configure your environment:
For users outside Databricks notebooks: Set your Databricks environment variables:
export DATABRICKS_HOST="https://your-workspace.cloud.databricks.com"
export DATABRICKS_TOKEN="your-personal-access-token"
For users inside Databricks notebooks: These credentials are automatically set for you.
AWS Credentials: Ensure your AWS credentials for Bedrock access are configured. For production use, consider using IAM roles, AWS Secrets Manager, or Databricks secrets instead of environment variables (e.g., using AWS CLI, IAM roles, or environment variables).
Supported APIs
MLflow supports automatic tracing for the following Amazon Bedrock APIs:
Basic Example
import boto3
import mlflow
import os

# Ensure your AWS credentials are configured in your environment
# (e.g., using AWS CLI `aws configure`, or by setting
#  AWS_ACCESS_KEY_ID, AWS_SECRET_ACCESS_KEY, AWS_SESSION_TOKEN, AWS_DEFAULT_REGION)

# Enable auto-tracing for Amazon Bedrock
mlflow.bedrock.autolog()

# Set up MLflow tracking to Databricks
mlflow.set_tracking_uri("databricks")
mlflow.set_experiment("/Shared/bedrock-tracing-demo")

# Create a boto3 client for invoking the Bedrock API
bedrock = boto3.client(
    service_name="bedrock-runtime",
    region_name="<REPLACE_WITH_YOUR_AWS_REGION>",
)
# MLflow will log a trace for Bedrock API call
response = bedrock.converse(
    modelId="anthropic.claude-3-5-sonnet-20241022-v2:0",
    messages=[
        {
            "role": "user",
            "content": "Describe the purpose of a 'hello world' program in one line.",
        }
    ],
    inferenceConfig={
        "maxTokens": 512,
        "temperature": 0.1,
        "topP": 0.9,
    },
)
The logged trace, associated with the experiment, can be seen in the MLflow UI.
Raw Inputs and Outputs
By default, MLflow renders the rich chat-like UI for input and output messages in the Chat tab. To view the raw input and output payload, including configuration parameters, click on the Inputs / Outputs tab in the UI.
The Chat panel is only supported for the converse and converse_stream APIs. For the other APIs, MLflow only displays the Inputs / Outputs tab.
Streaming
MLflow supports tracing streaming calls to Amazon Bedrock APIs. The generated trace shows the aggregated output message in the Chat tab, while the individual chunks are displayed in the Events tab.
response = bedrock.converse_stream(
    modelId="anthropic.claude-3-5-sonnet-20241022-v2:0",
    messages=[
        {
            "role": "user",
            "content": [
                {"text": "Describe the purpose of a 'hello world' program in one line."}
            ],
        }
    ],
    inferenceConfig={
        "maxTokens": 300,
        "temperature": 0.1,
        "topP": 0.9,
    },
)

for chunk in response["stream"]:
    print(chunk)
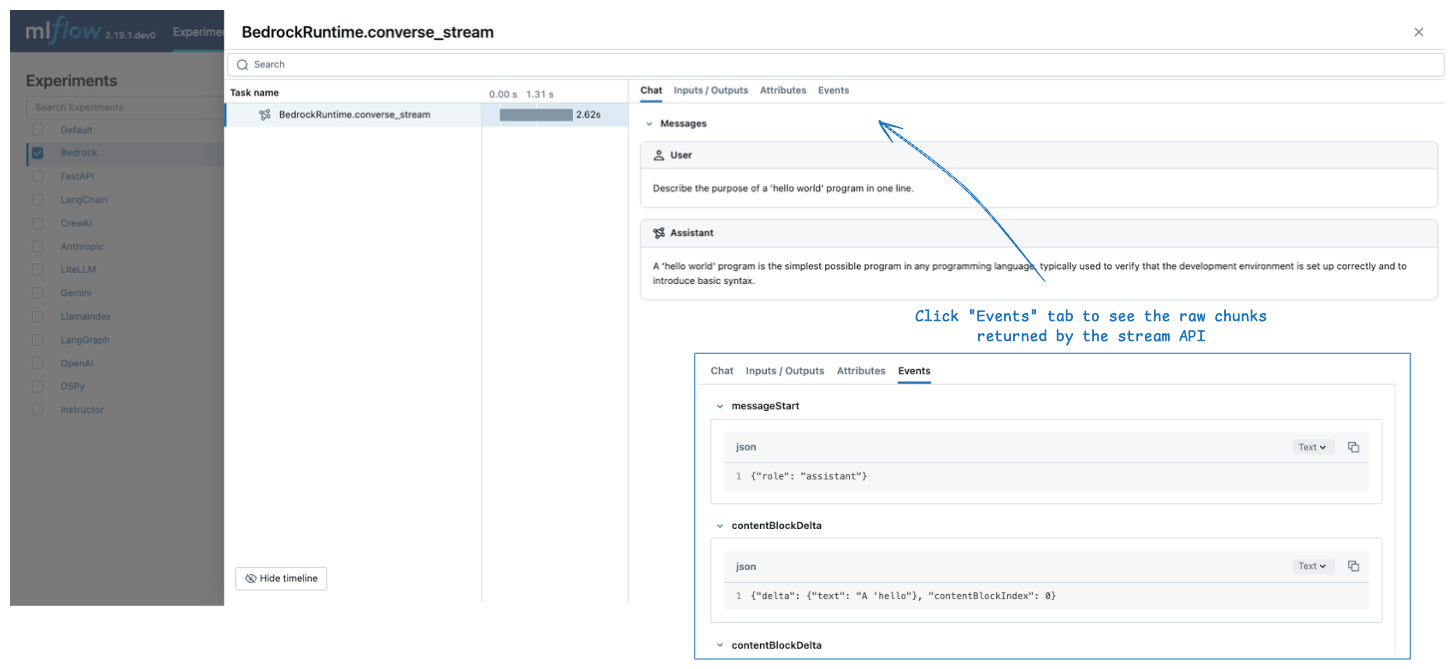
MLflow does not create a span immediately when the streaming response is returned. Instead, it creates a span when the streaming chunks are consumed, for example, the for-loop in the code snippet above.
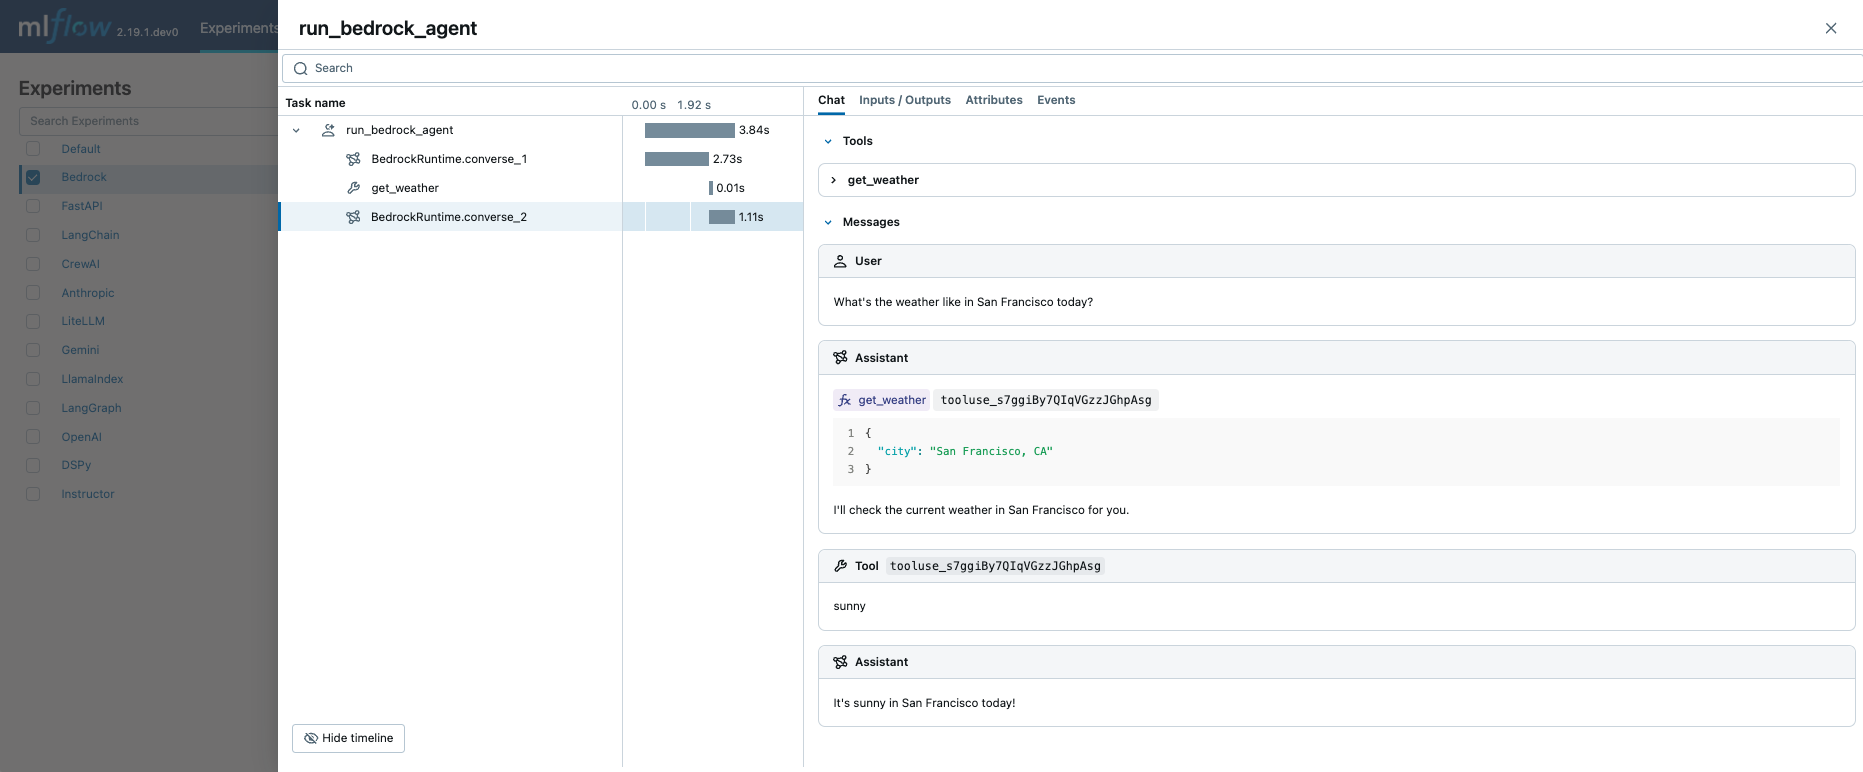
Function Calling Agent
MLflow Tracing automatically captures function calling metadata when calling Amazon Bedrock APIs. The function definition and instruction in the response will be highlighted in the Chat tab on trace UI.
Combining this with the manual tracing feature, you can define a function-calling agent (ReAct) and trace its execution. The entire agent implementation might look complicated, but the tracing part is pretty straightforward: (1) add the @mlflow.trace decorator to functions to trace and (2) enable auto-tracing for Amazon Bedrock with mlflow.bedrock.autolog(). MLflow will take care of the complexity such as resolving call chains and recording execution metadata.
import boto3
import mlflow
from mlflow.entities import SpanType
import os

# Ensure your AWS credentials are configured in your environment

# Enable auto-tracing for Amazon Bedrock
mlflow.bedrock.autolog()

# Set up MLflow tracking to Databricks
mlflow.set_tracking_uri("databricks")
mlflow.set_experiment("/Shared/bedrock-agent-demo")

# Create a boto3 client for invoking the Bedrock API
bedrock = boto3.client(
    service_name="bedrock-runtime",
    region_name="<REPLACE_WITH_YOUR_AWS_REGION>",
)
model_id = "anthropic.claude-3-5-sonnet-20241022-v2:0"


# Define the tool function. Decorate it with `@mlflow.trace` to create a span for its execution.
@mlflow.trace(span_type=SpanType.TOOL)
def get_weather(city: str) -> str:
    """ "Get the current weather in a given location"""
    return "sunny" if city == "San Francisco, CA" else "unknown"


# Define the tool configuration passed to Bedrock
tools = [
    {
        "toolSpec": {
            "name": "get_weather",
            "description": "Get the current weather in a given location",
            "inputSchema": {
                "json": {
                    "type": "object",
                    "properties": {
                        "city": {
                            "type": "string",
                            "description": "The city and state, e.g., San Francisco, CA",
                        },
                    },
                    "required": ["city"],
                }
            },
        }
    }
]
tool_functions = {"get_weather": get_weather}


# Define a simple tool calling agent
@mlflow.trace(span_type=SpanType.AGENT)
def run_tool_agent(question: str) -> str:
    messages = [{"role": "user", "content": [{"text": question}]}]
    # Invoke the model with the given question and available tools
    response = bedrock.converse(
        modelId=model_id,
        messages=messages,
        toolConfig={"tools": tools},
    )
    assistant_message = response["output"]["message"]
    messages.append(assistant_message)
    # If the model requests tool call(s), invoke the function with the specified arguments
    tool_use = next(
        (c["toolUse"] for c in assistant_message["content"] if "toolUse" in c), None
    )
    if tool_use:
        tool_func = tool_functions[tool_use["name"]]
        tool_result = tool_func(**tool_use["input"])
        messages.append(
            {
                "role": "user",
                "content": [
                    {
                        "toolResult": {
                            "toolUseId": tool_use["toolUseId"],
                            "content": [{"text": tool_result}],
                        }
                    }
                ],
            }
        )
        # Send the tool results to the model and get a new response
        response = bedrock.converse(
            modelId=model_id,
            messages=messages,
            toolConfig={"tools": tools},
        )
    return response["output"]["message"]["content"][0]["text"]


# Run the tool calling agent
question = "What's the weather like in San Francisco today?"
answer = run_tool_agent(question)
Executing the code above will create a single trace that involves all LLM invocations and the tool calls.
For production environments, always use AI Gateway or Databricks secrets instead of hardcoded values for secure API key management.
Disable auto-tracing
Auto tracing for Amazon Bedrock can be disabled globally by calling mlflow.bedrock.autolog(disable=True) or mlflow.autolog(disable=True).