Tracing LangGraph

LangGraph is an open-source library for building stateful, multi-actor applications with LLMs, used to create agent and multi-agent workflows.
MLflow Tracing provides automatic tracing capability for LangGraph, as a extension of its LangChain integration. By enabling auto-tracing for LangChain by calling the mlflow.langchain.autolog function, MLflow will
automatically capture the graph execution into a trace and log it to the active MLflow Experiment.
import mlflow

mlflow.langchain.autolog()
On serverless compute clusters, autologging is not automatically enabled. You must explicitly call mlflow.langchain.autolog() to enable automatic tracing for this integration.
Prerequisites
To use MLflow Tracing with LangGraph, you need to install MLflow and the relevant LangGraph and LangChain packages (e.g., langgraph, langchain_core, langchain_openai).
- Development
- Production
For development environments, install the full MLflow package with Databricks extras and LangGraph/LangChain packages:
pip install --upgrade "mlflow[databricks]>=3.1" langgraph langchain_core langchain_openai
# Add other langchain packages if needed by your graph
The full mlflow[databricks] package includes all features for local development and experimentation on Databricks.
For production deployments, install mlflow-tracing and LangGraph/LangChain packages:
pip install --upgrade mlflow-tracing langgraph langchain_core langchain_openai
# Add other langchain packages if needed by your graph
The mlflow-tracing package is optimized for production use.
MLflow 3 is highly recommended for the best tracing experience with LangGraph, as it relies on the LangChain autologging integration.
Before running the examples, you'll need to configure your environment:
For users outside Databricks notebooks: Set your Databricks environment variables:
export DATABRICKS_HOST="https://your-workspace.cloud.databricks.com"
export DATABRICKS_TOKEN="your-personal-access-token"
For users inside Databricks notebooks: These credentials are automatically set for you.
API Keys: Ensure your LLM provider API keys are configured. For production environments, use AI Gateway or Databricks secrets instead of hardcoded values for secure API key management.
export OPENAI_API_KEY="your-openai-api-key"
# Add other provider keys as needed
Usage
Running the following code will generate a trace for the graph as shown in the above video clip.
from typing import Literal
import os
import mlflow

from langchain_core.messages import AIMessage, ToolCall
from langchain_core.outputs import ChatGeneration, ChatResult
from langchain_core.tools import tool
from langchain_openai import ChatOpenAI
from langgraph.prebuilt import create_react_agent

# Ensure your OPENAI_API_KEY (or other LLM provider keys) is set in your environment
# os.environ["OPENAI_API_KEY"] = "your-openai-api-key" # Uncomment and set if not globally configured

# Enabling tracing for LangGraph (LangChain)
mlflow.langchain.autolog()

# Set up MLflow tracking to Databricks
mlflow.set_tracking_uri("databricks")
mlflow.set_experiment("/Shared/langgraph-tracing-demo")


@tool
def get_weather(city: Literal["nyc", "sf"]):
    """Use this to get weather information."""
    if city == "nyc":
        return "It might be cloudy in nyc"
    elif city == "sf":
        return "It's always sunny in sf"


llm = ChatOpenAI(model="gpt-4o-mini")
tools = [get_weather]
graph = create_react_agent(llm, tools)

# Invoke the graph
result = graph.invoke(
    {"messages": [{"role": "user", "content": "what is the weather in sf?"}]}
)
Adding spans within a node or a tool
By combining auto-tracing with the manual tracing APIs, you can add child spans inside a node or tool, to get more detailed insights for the step.
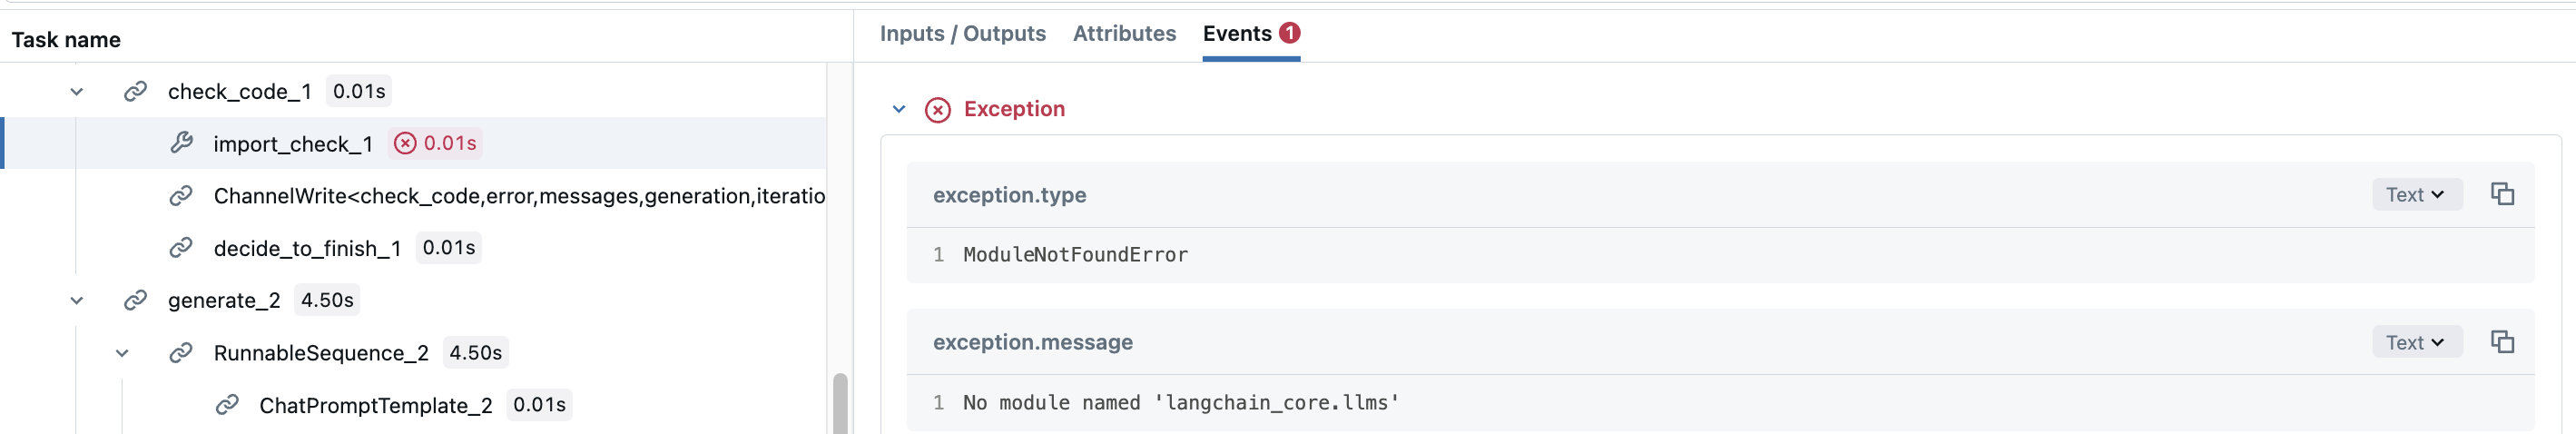
Let's take LangGraph's Code Assistant tutorial for example. The check_code node actually consists of two different validations for the generated code. You may want to add span for each validation to see which validation were executed. To do so, simply create manual spans inside the node function.
def code_check(state: GraphState):
    # State
    messages = state["messages"]
    code_solution = state["generation"]
    iterations = state["iterations"]

    # Get solution components
    imports = code_solution.imports
    code = code_solution.code

    # Check imports
    try:
        # Create a child span manually with mlflow.start_span() API
        with mlflow.start_span(name="import_check", span_type=SpanType.TOOL) as span:
            span.set_inputs(imports)
            exec(imports)
            span.set_outputs("ok")
    except Exception as e:
        error_message = [("user", f"Your solution failed the import test: {e}")]
        messages += error_message
        return {
            "generation": code_solution,
            "messages": messages,
            "iterations": iterations,
            "error": "yes",
        }

    # Check execution
    try:
        code = imports + "\n" + code
        with mlflow.start_span(name="execution_check", span_type=SpanType.TOOL) as span:
            span.set_inputs(code)
            exec(code)
            span.set_outputs("ok")
    except Exception as e:
        error_message = [("user", f"Your solution failed the code execution test: {e}")]
        messages += error_message
        return {
            "generation": code_solution,
            "messages": messages,
            "iterations": iterations,
            "error": "yes",
        }

    # No errors
    return {
        "generation": code_solution,
        "messages": messages,
        "iterations": iterations,
        "error": "no",
    }
This way, the span for the check_code node will have child spans, which record whether the each validation fails or not, with their exception details.
For production environments, use AI Gateway or Databricks secrets instead of hardcoded values for secure API key management.
Disable auto-tracing
Auto tracing for LangGraph can be disabled globally by calling mlflow.langchain.autolog(disable=True) or mlflow.autolog(disable=True).