View traces in the Databricks MLflow UI
All captured traces are logged to an MLflow Experiment. When MLFLOW_TRACKING_URI is set to databricks, the managed MLflow Tracking service in your workspace stores and serves them, with no additional hosting to run. Access them through the MLflow UI in your Databricks workspace.
-
Navigate to your Experiment: Go to the experiment where your traces are logged. For example, the experiment set by
mlflow.set_experiment("/Shared/my-genai-app-traces")). -
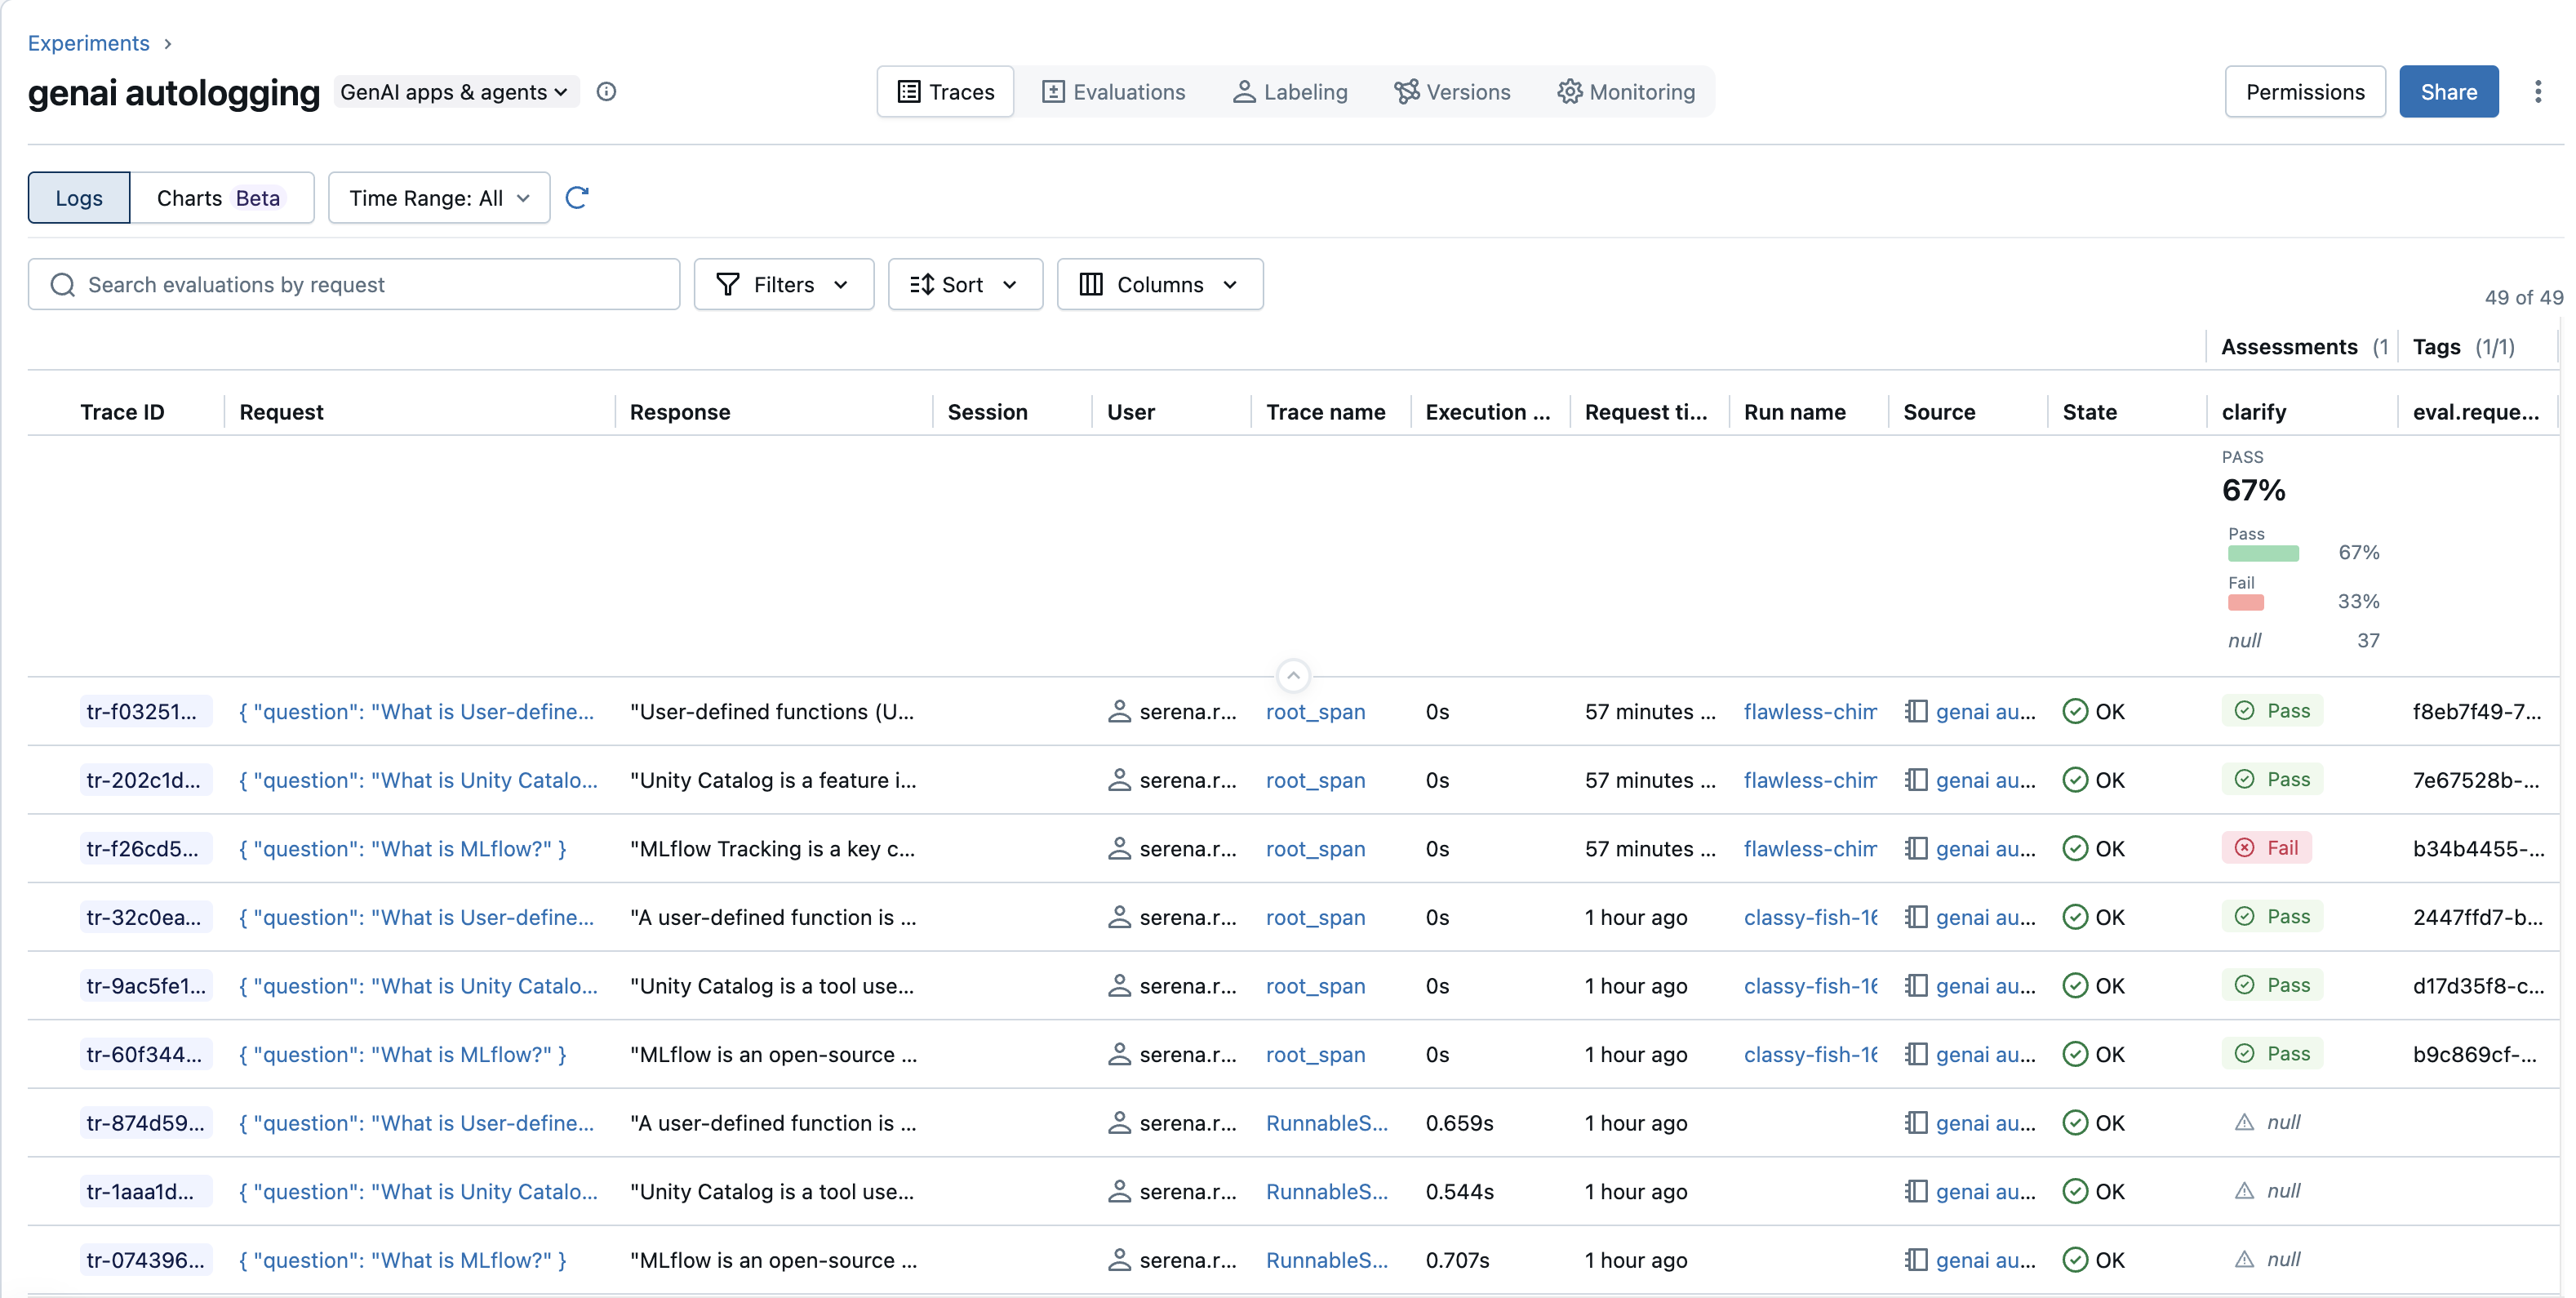
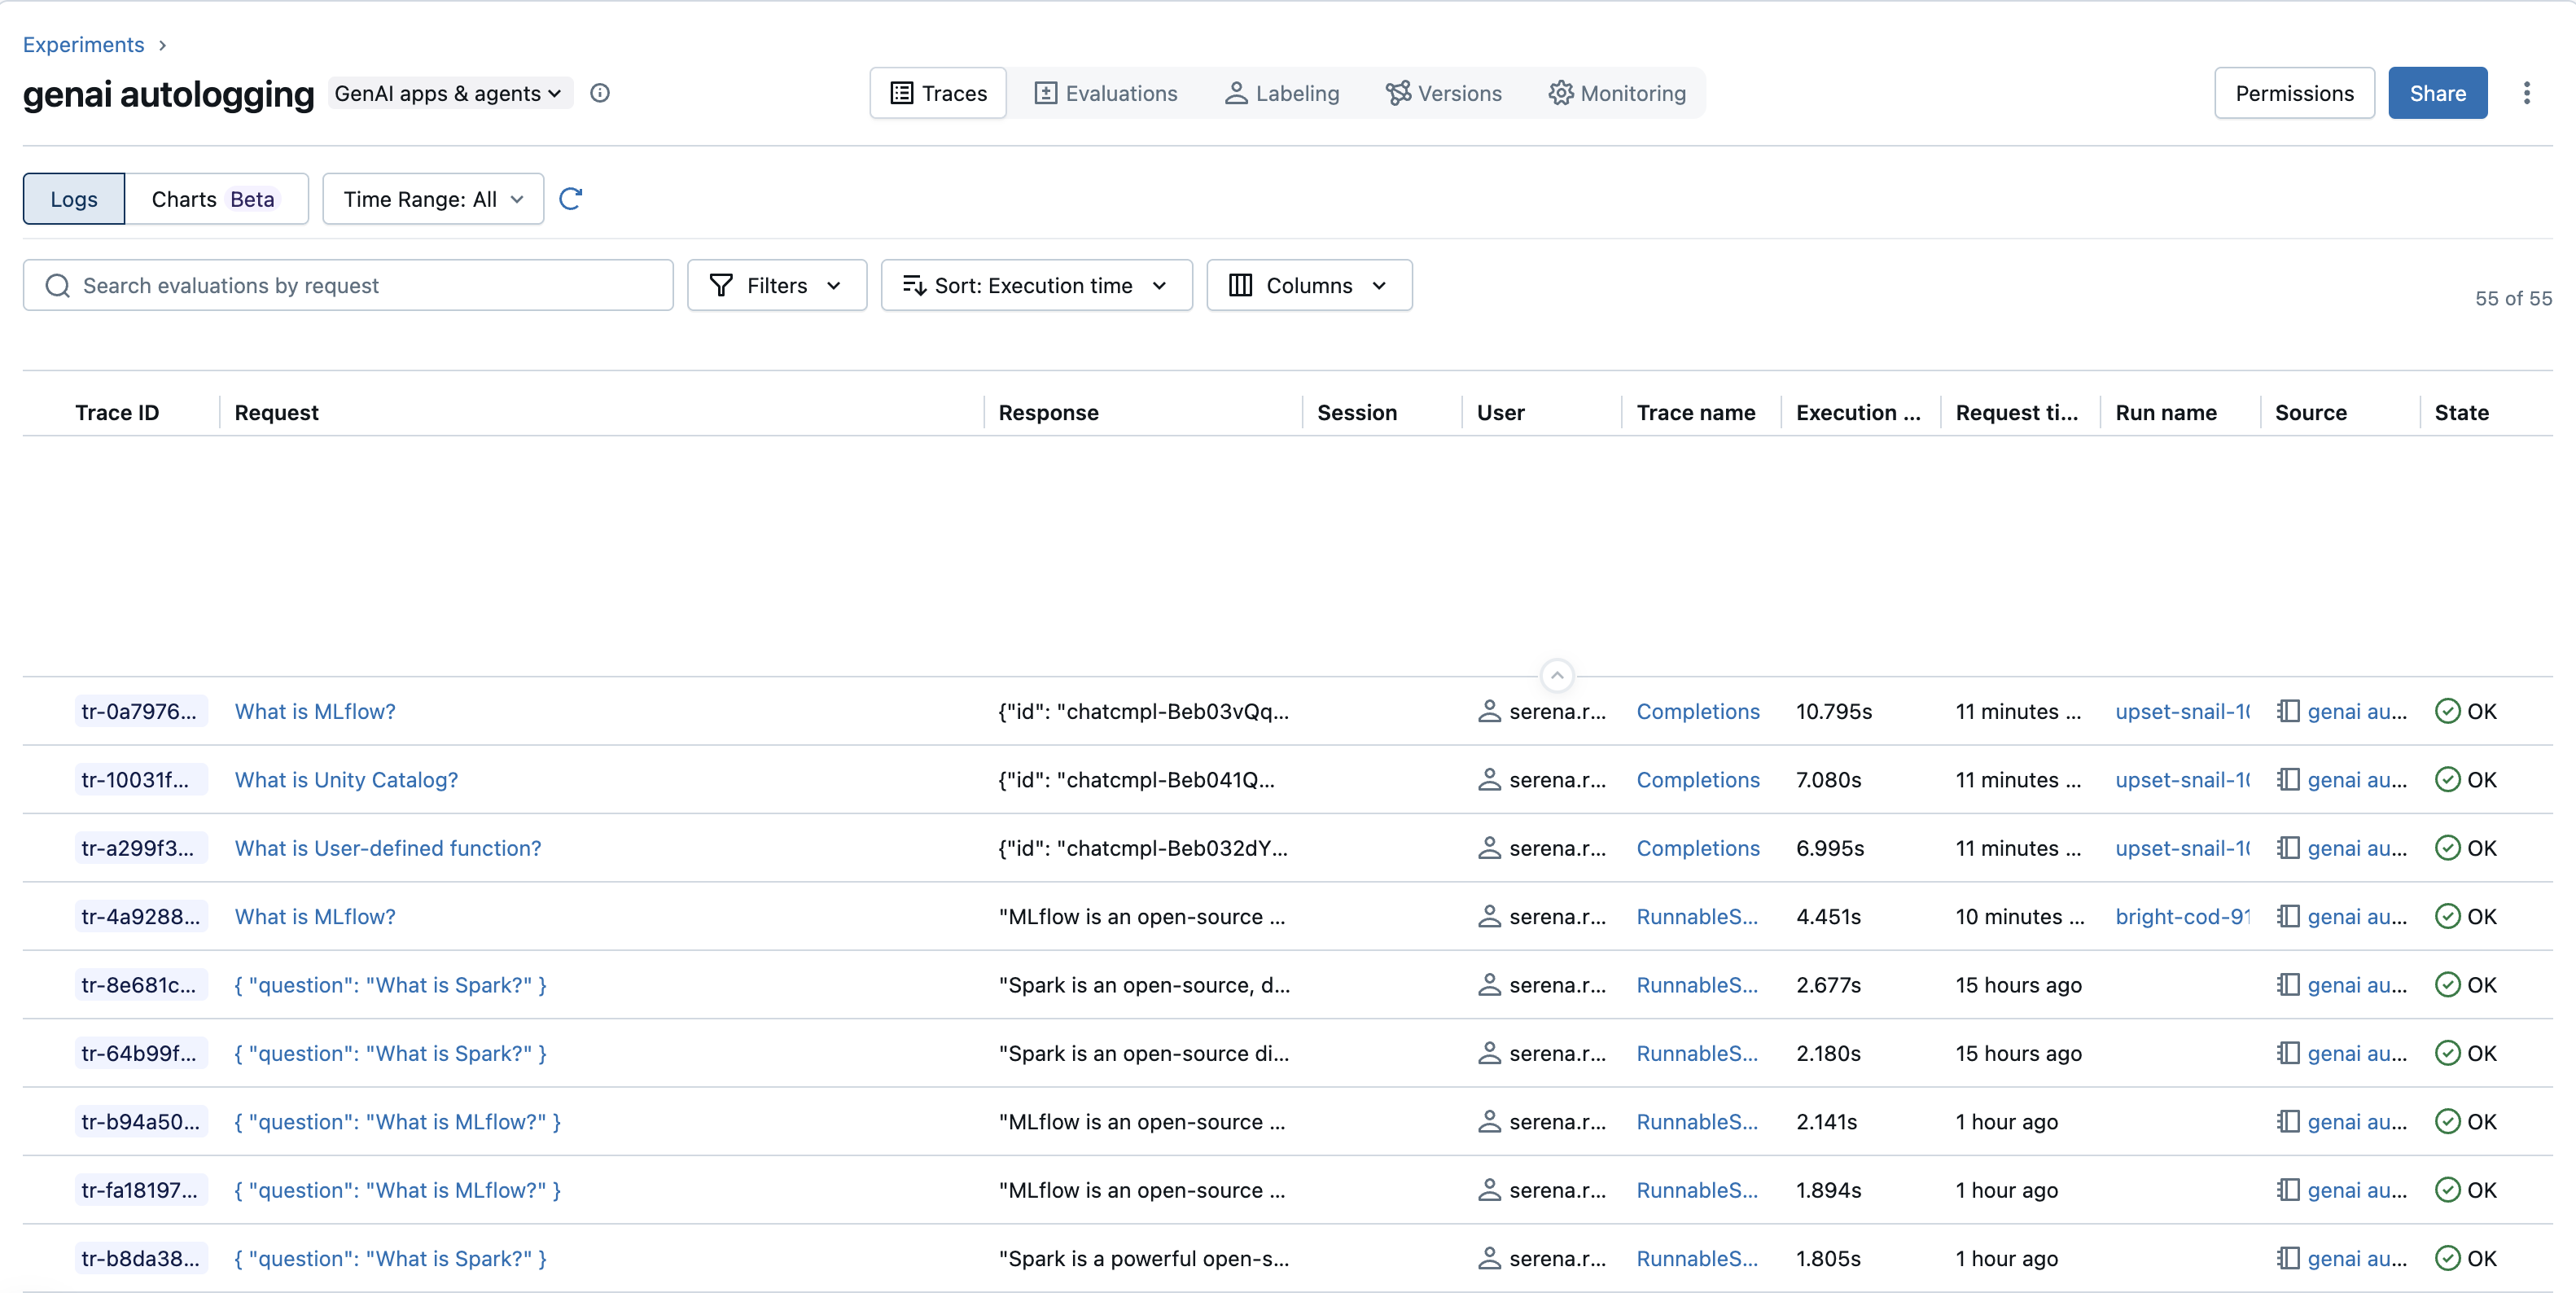
Open the Traces tab: In the experiment view, click on the Traces tab to see a list of all traces logged to that experiment.
Understand the trace list
The trace list gives a high-level overview of your traces, with sortable columns:
- Trace ID: The unique identifier for each trace.
- Request: A preview of the input that triggered the trace.
- Response: A preview of the trace's final output.
- Session: The session identifier that groups related traces, such as the turns in a conversation. Shown when provided.
- User: The user identifier. Shown when provided.
- Execution time: The total time the trace took to complete.
- Request time: The timestamp when the trace started.
- Run name: The name of the associated MLflow Run, linked to it, when the trace belongs to a Run.
- Source: The origin of the trace, such as the instrumented library or component (
openai,langchain, or a custom trace name). - State: The trace status (
OK,ERROR,IN_PROGRESS). - Trace name: The name assigned to the trace, usually the root span's name.
- Assessments: One column per assessment type (for example,
my_scorer,professional). A summary section above the list shows aggregated assessment metrics, such as averages or pass/fail rates, across the visible traces. - Tags: Tags shown as columns (for example,
persona,style).
Search and filter traces
The UI offers several ways to find relevant traces:
- Search bar: By default, search traces by keyword across their ID, input, and output.
- Filter with AI: Click the sparkle icon in the search bar to switch to AI search, then describe the traces you want in plain English (for example, "traces with errors" or "traces slower than 5 seconds") and press Enter. MLflow converts your description into a structured filter over the filterable trace fields. For analytical questions across many traces, open Genie Code.
- Filters dropdown: Build structured queries on:
- Attributes:
Requestcontent,Session time,Execution time, orRequest time. - Assessments: Filter by the presence or value of assessments such as
my_scorerorprofessional. - Other fields such as
State,Trace name,Session,User, andTags(for example,tags.persona = 'expert').
- Attributes:
- Sort dropdown: Order traces by columns such as
Request timeorExecution time. - Columns dropdown: Choose which columns are visible, including specific tags or assessment metrics.

Metadata filters
In the MLflow UI (Traces tab), you can view the attached metadata:
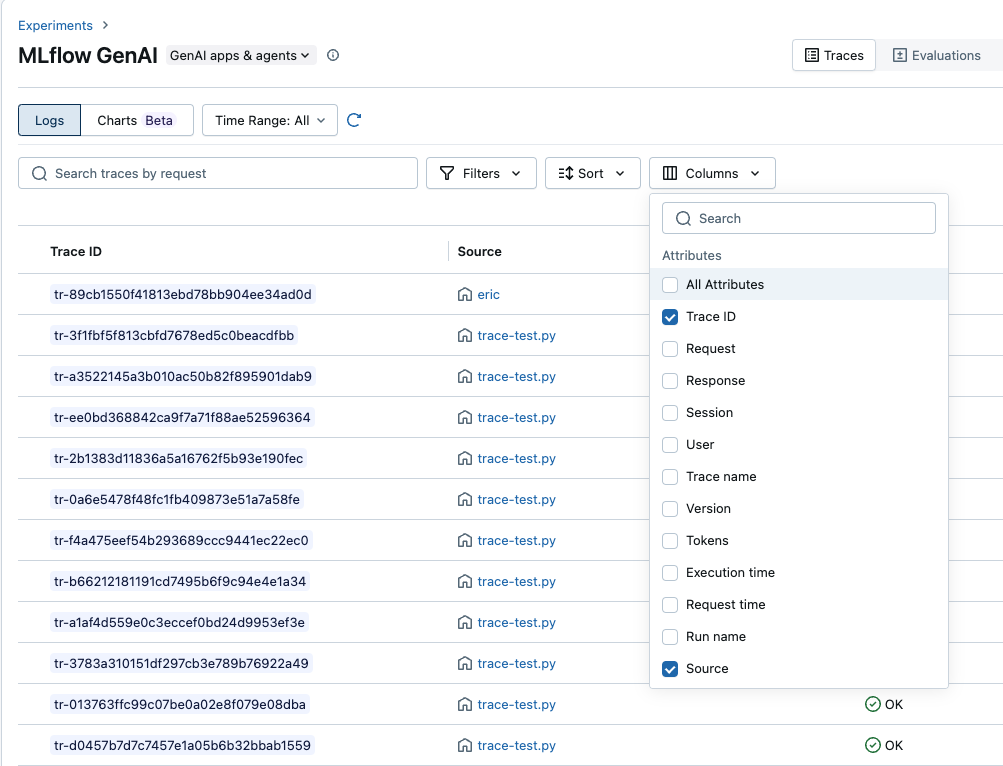
Filter traces in the MLflow UI using these search queries:
# Find all traces for a specific user
metadata.`mlflow.trace.user` = 'user-123'

# Find all traces in a session
metadata.`mlflow.trace.session` = 'session-abc-456'

# Find traces for a user within a specific session
metadata.`mlflow.trace.user` = 'user-123' AND metadata.`mlflow.trace.session` = 'session-abc-456'

# Find traces from production environment
metadata.`mlflow.source.type` = 'production'

# Find traces from a specific app version
metadata.app_version = '1.0.0'
Explore an individual trace
To inspect a specific trace, click its Request or Trace Name in the list. The detailed trace view has two tabs:
- Summary: A high-level overview of the trace. It shows the root span's inputs and outputs, key intermediate spans, and any exceptions raised during the trace. Use the Default, JSON, and Table toggles to change how inputs and outputs render.
- Details & Timeline: The full span breakdown with per-span details, described in the following section.
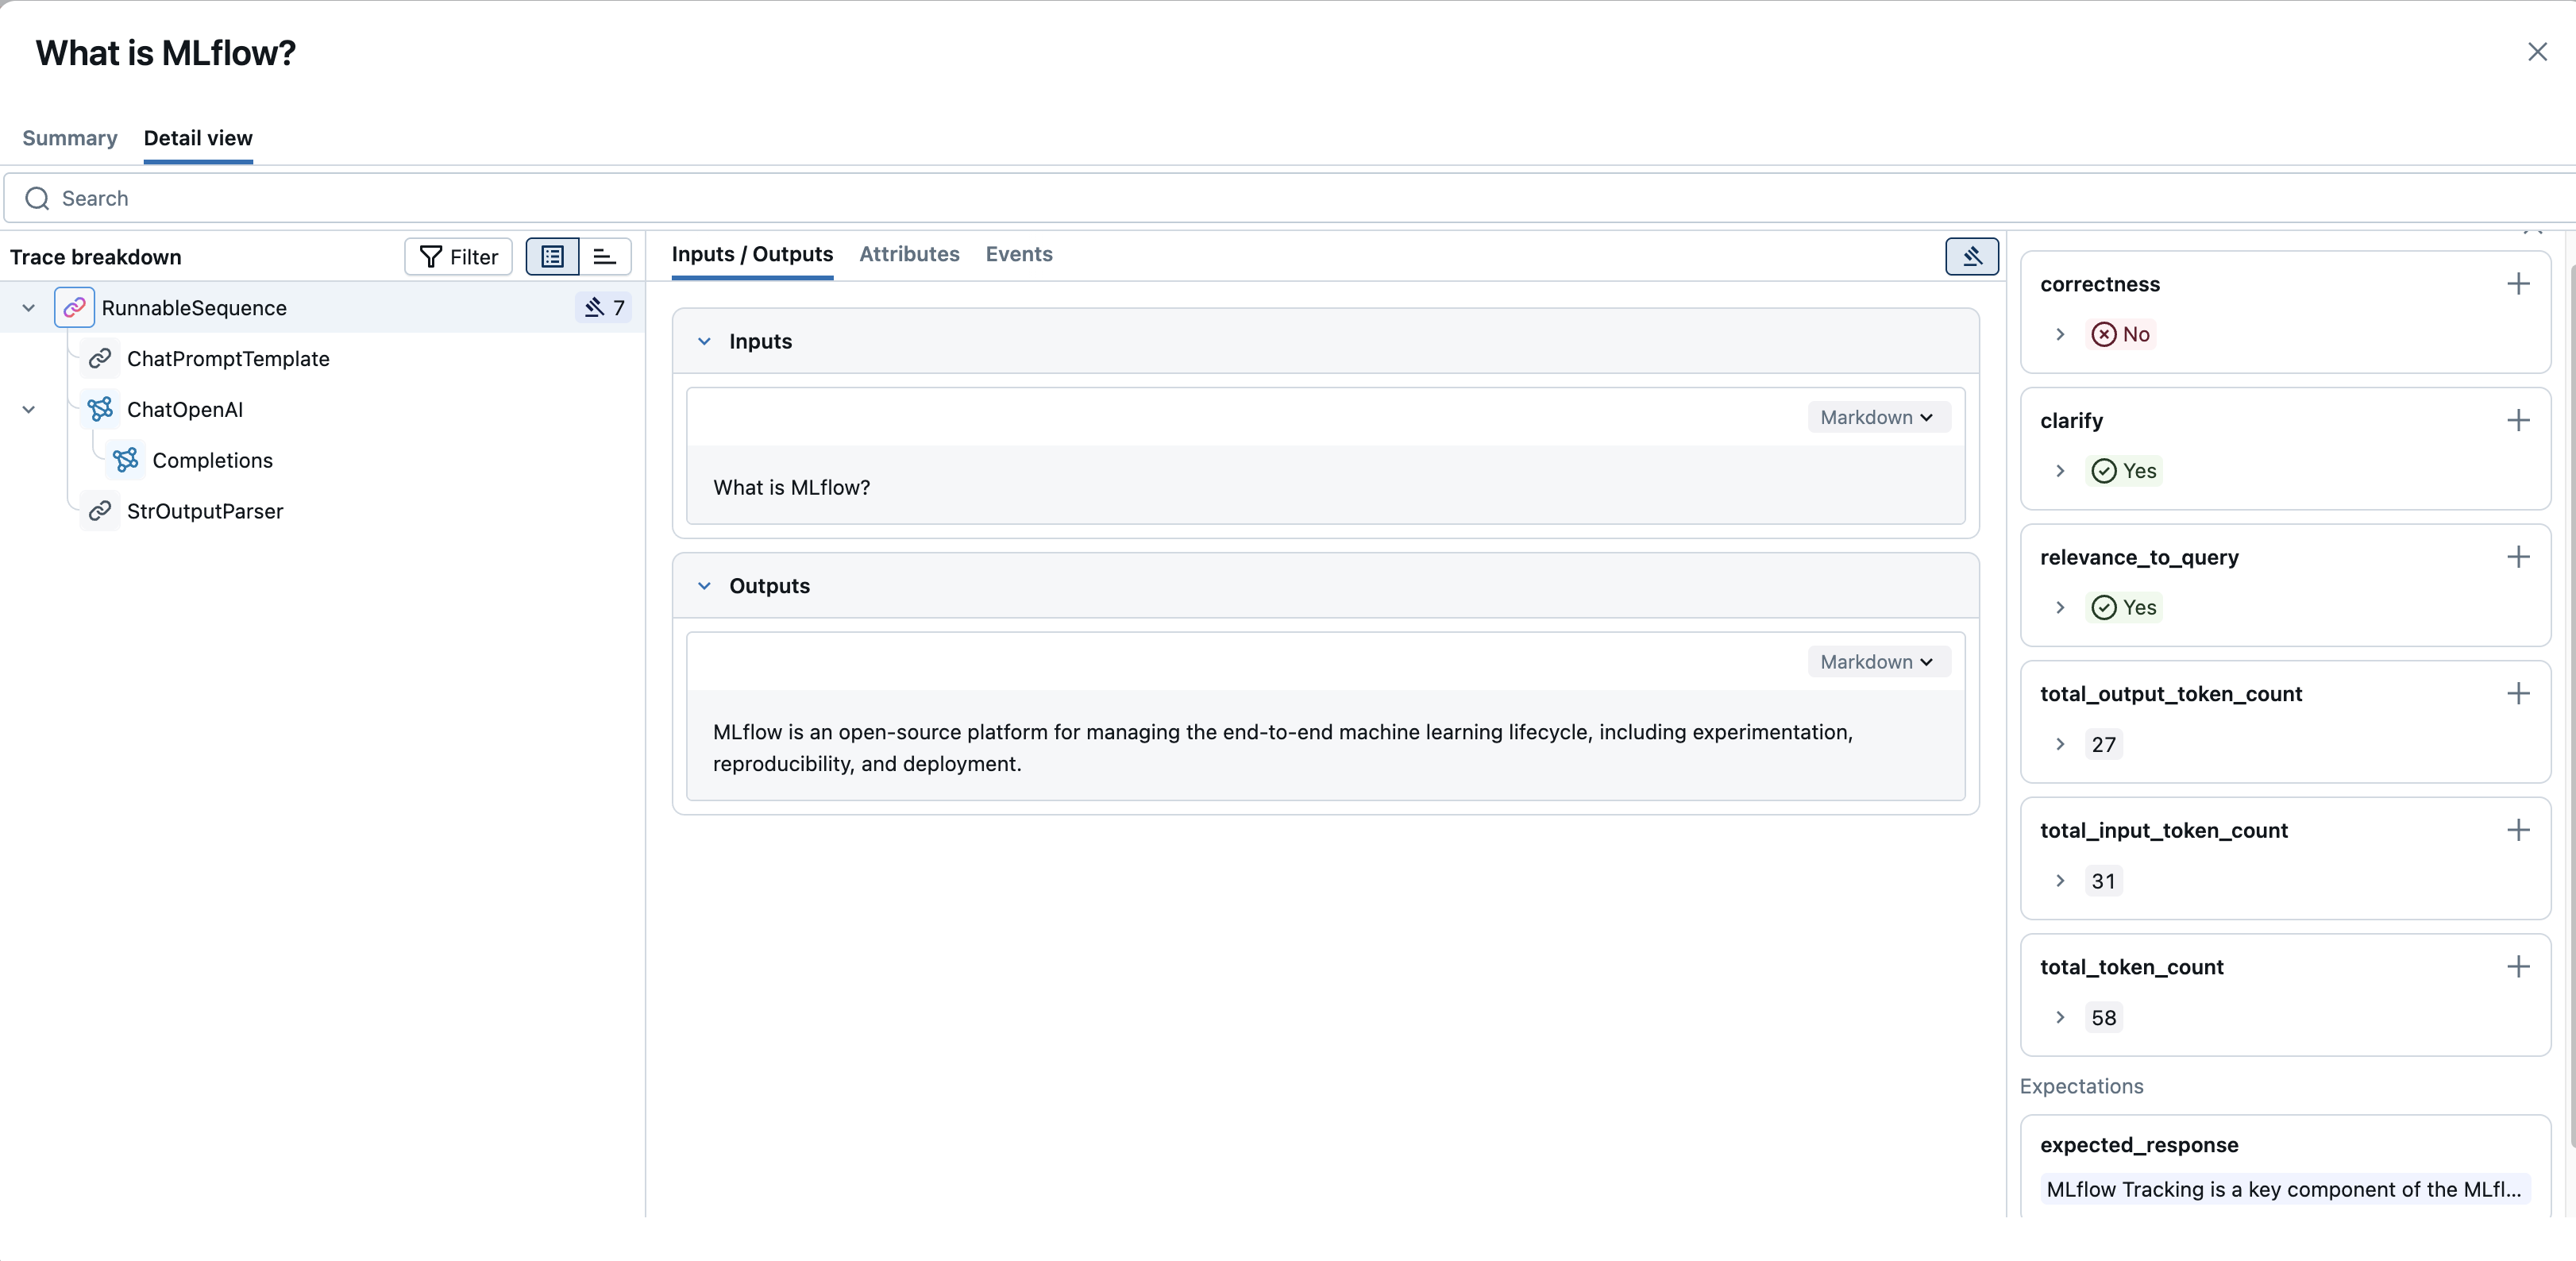
The Details & Timeline tab has three panels:
-
Trace breakdown (left panel):
- Displays the span hierarchy as a tree or waterfall chart. It shows all spans in the trace, their parent-child relationships, and their execution order and duration.
- Select a span to inspect its details.
-
Span details (center panel):
- When you select a span, this panel shows its details, organized into tabs:
-
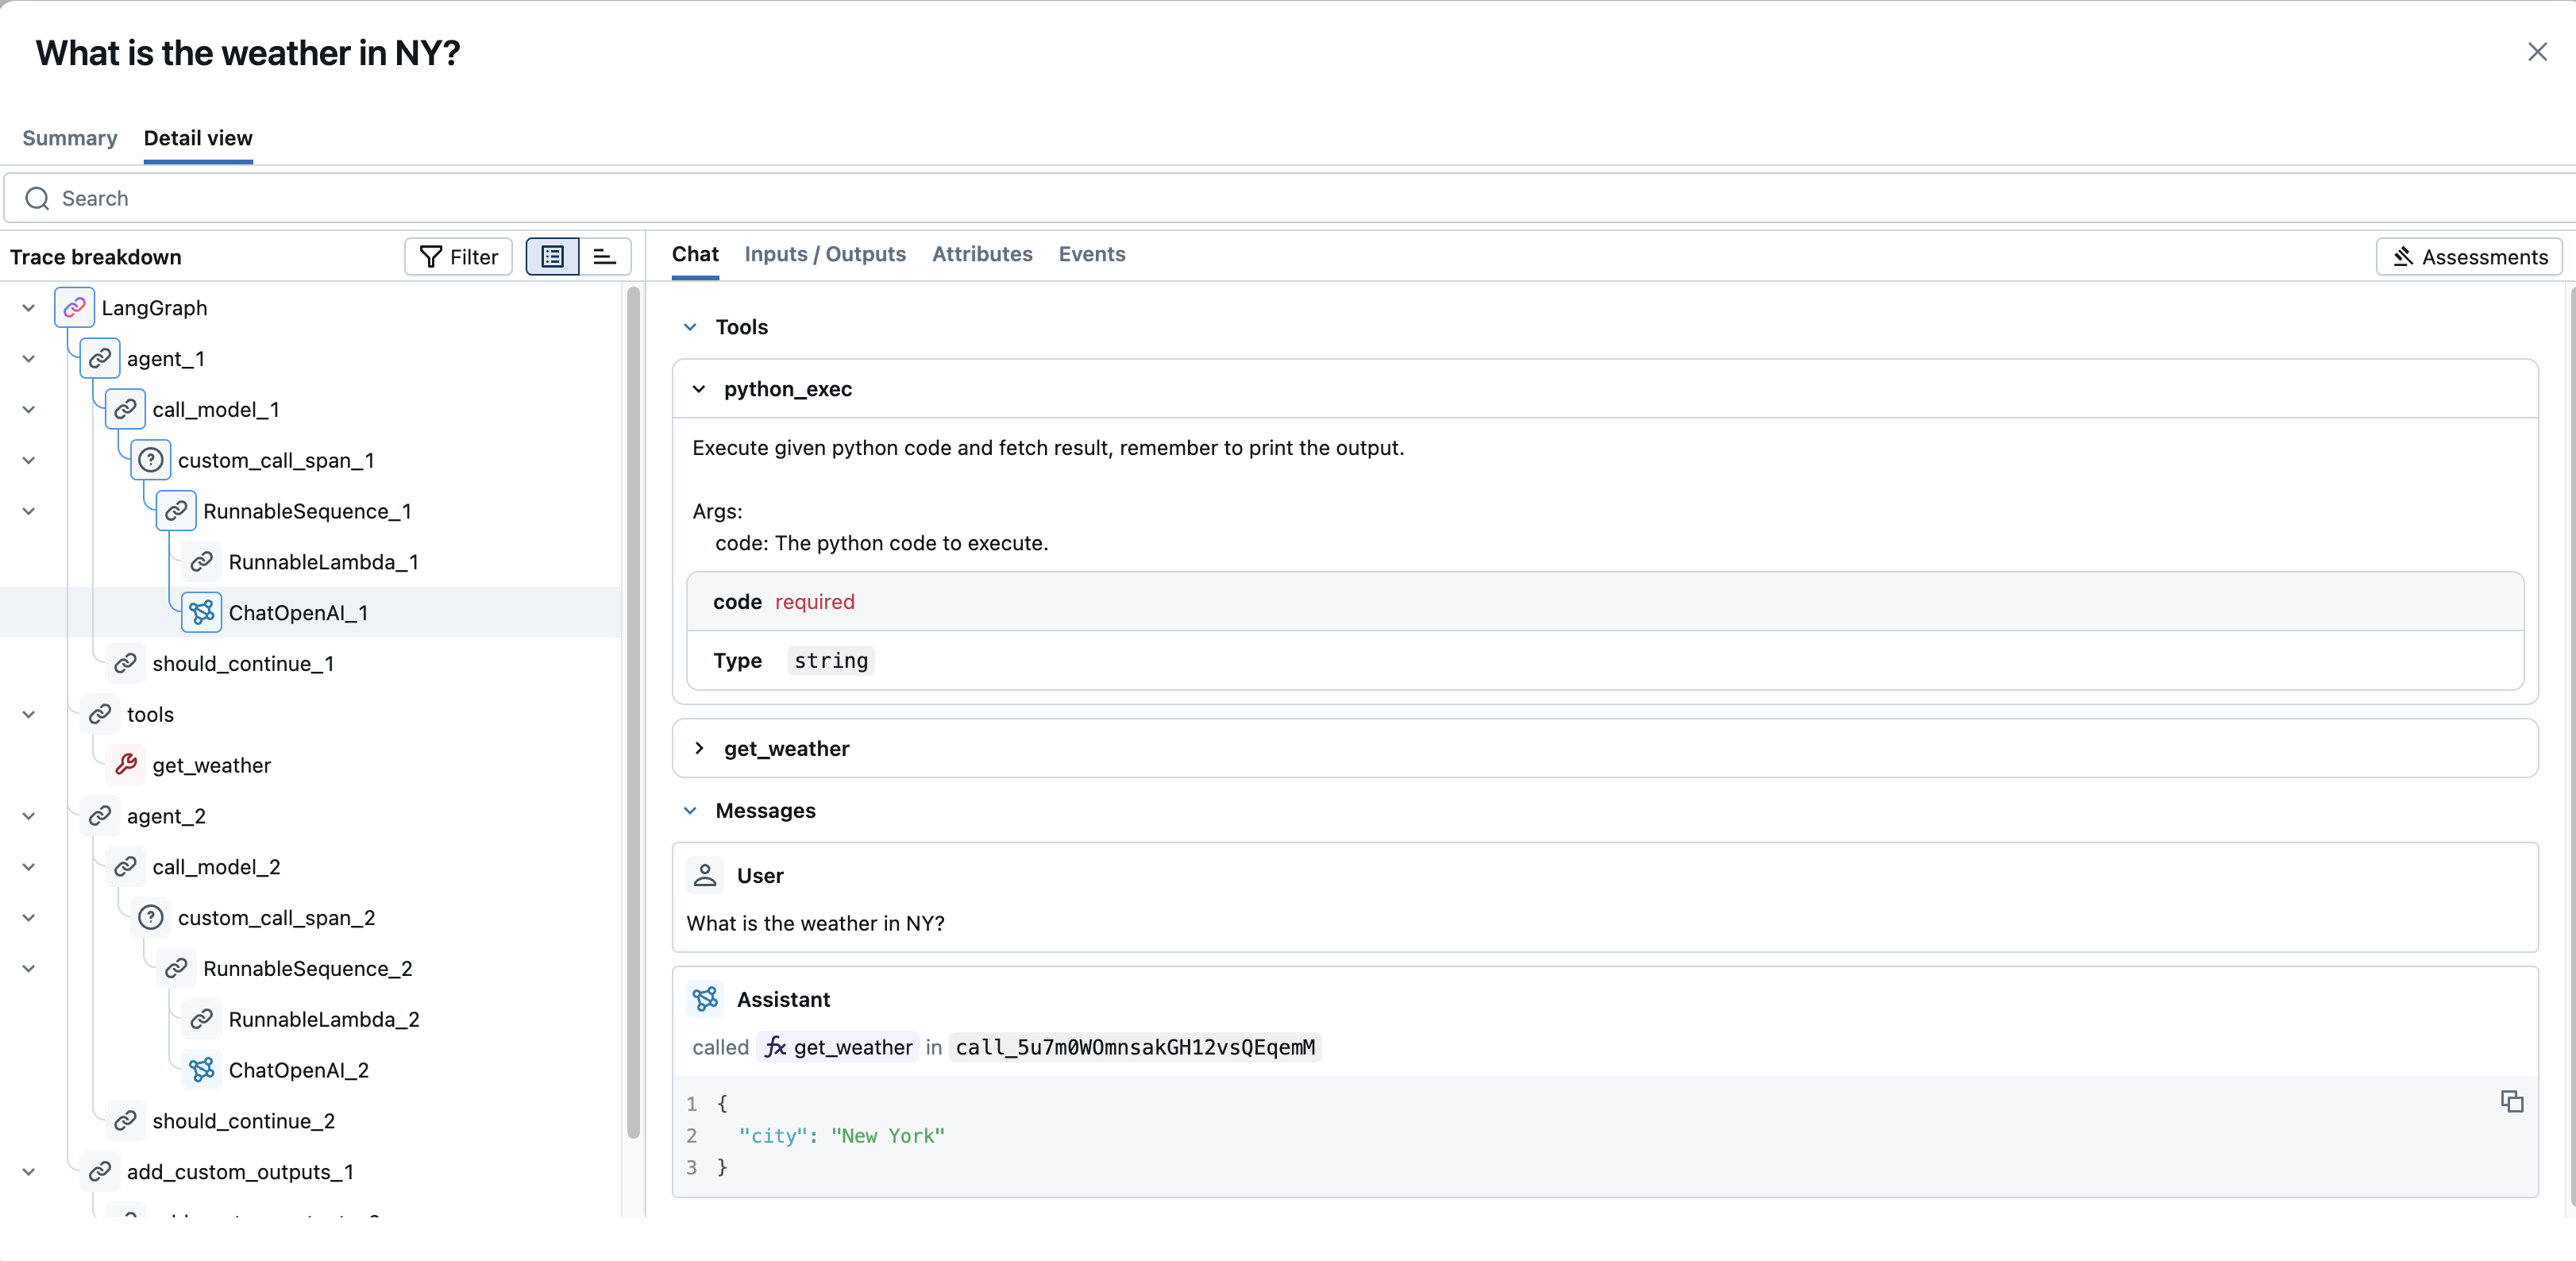
Chat: For chat-based LLM interactions, a rendered view of the conversation flow (user, assistant, and tool messages).
-
Inputs / Outputs: The raw input passed to the operation and the raw output it returned. For large content, use the "See more" / "See less" toggle to expand or collapse the view.
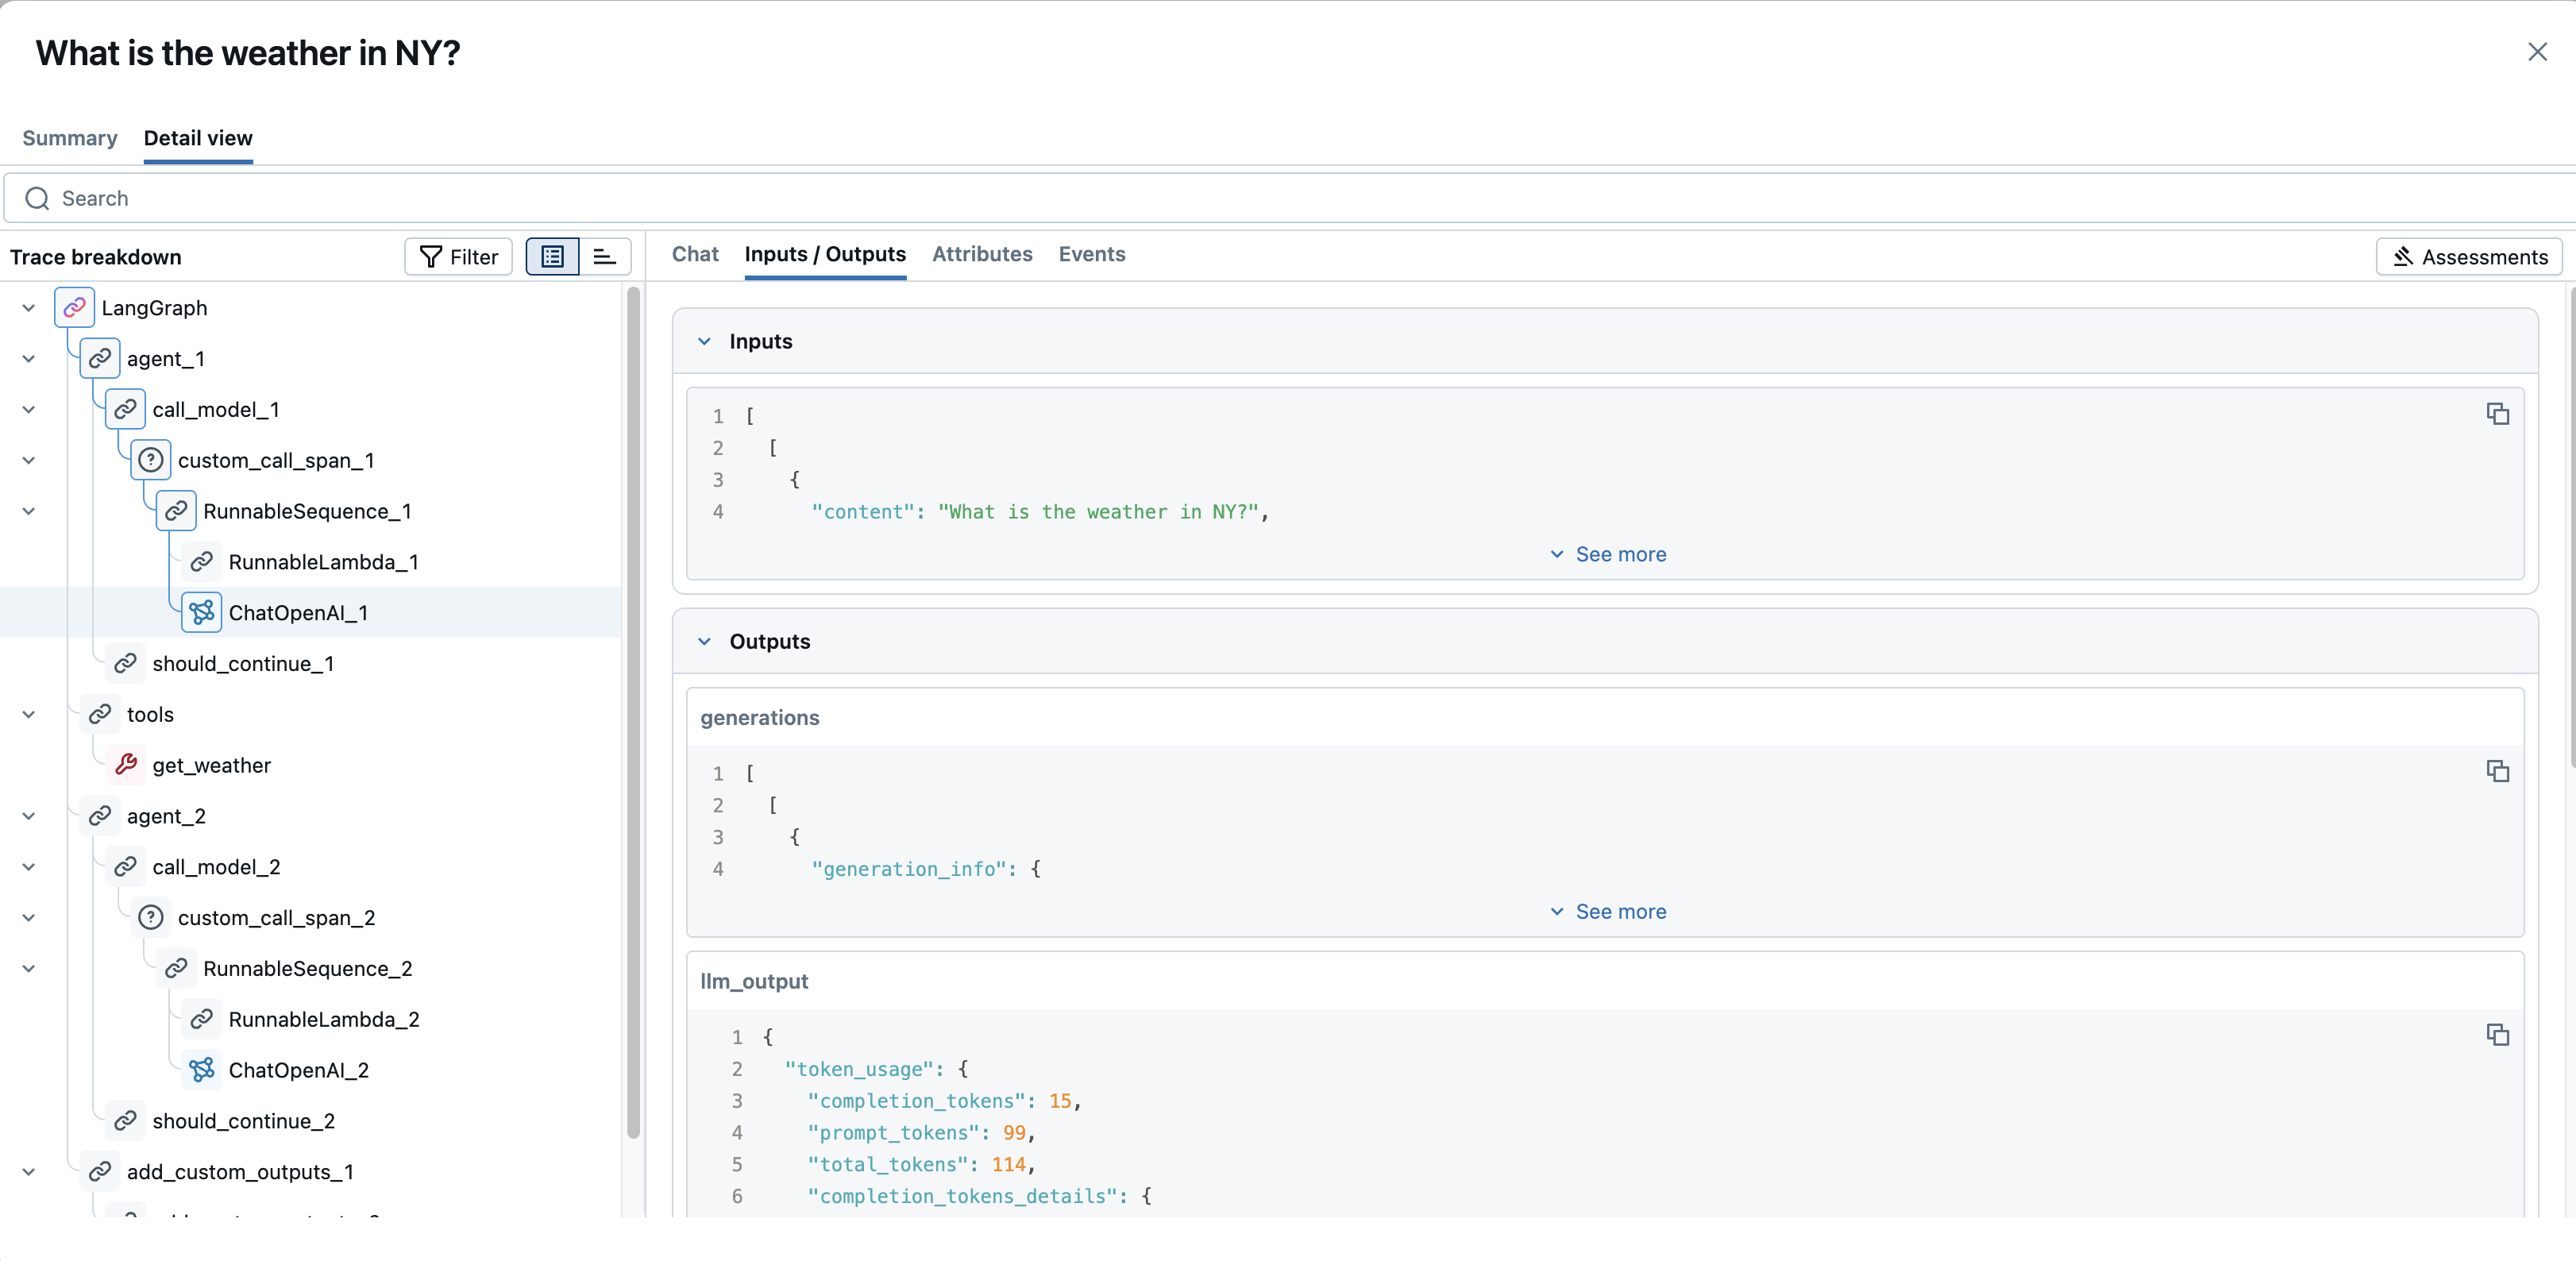
-
Attributes: Key-value metadata specific to the span (for example,
modelandtemperaturefor an LLM call, ordoc_urifor a retriever span).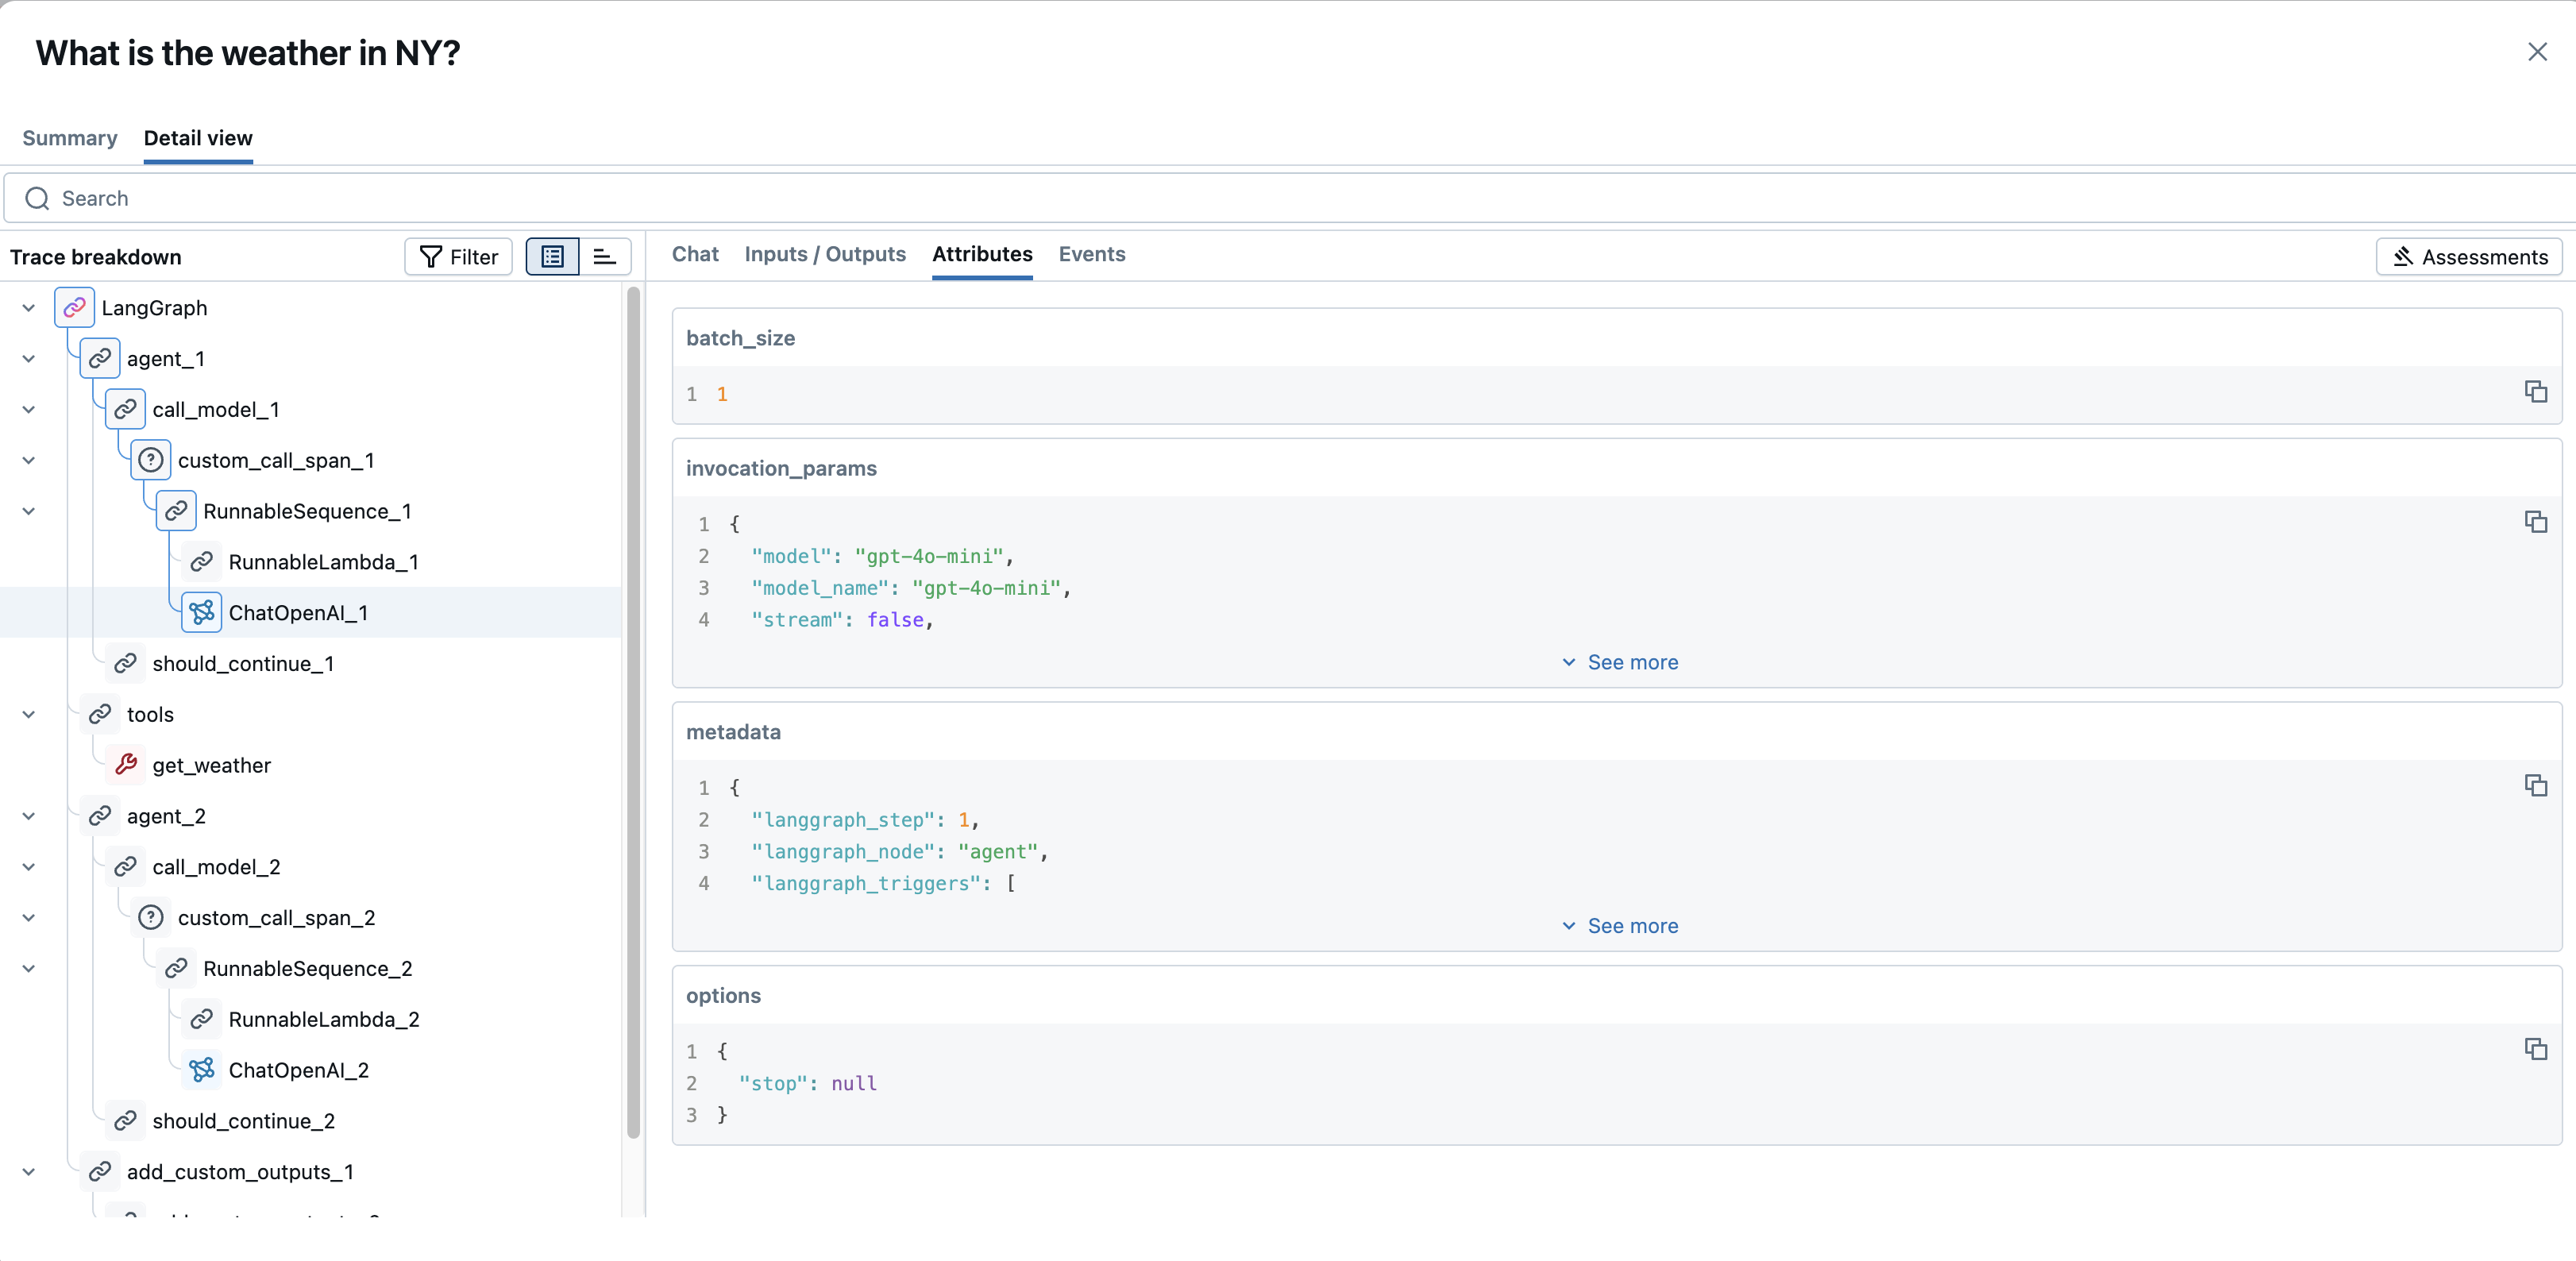
-
Events: For spans that raised errors, the exception details and stack traces. For streaming spans, the individual data chunks as they were yielded.
-
Some output fields have a Markdown toggle to switch between raw and rendered views when the content is Markdown.
-
- When you select a span, this panel shows its details, organized into tabs:
-
Assessments (right panel):
- Displays the assessments (user feedback or evaluations) logged for the entire trace or the selected span.
- Use the + Add new assessment button to log feedback or evaluation scores directly from the UI, which supports manual review and labeling workflows.
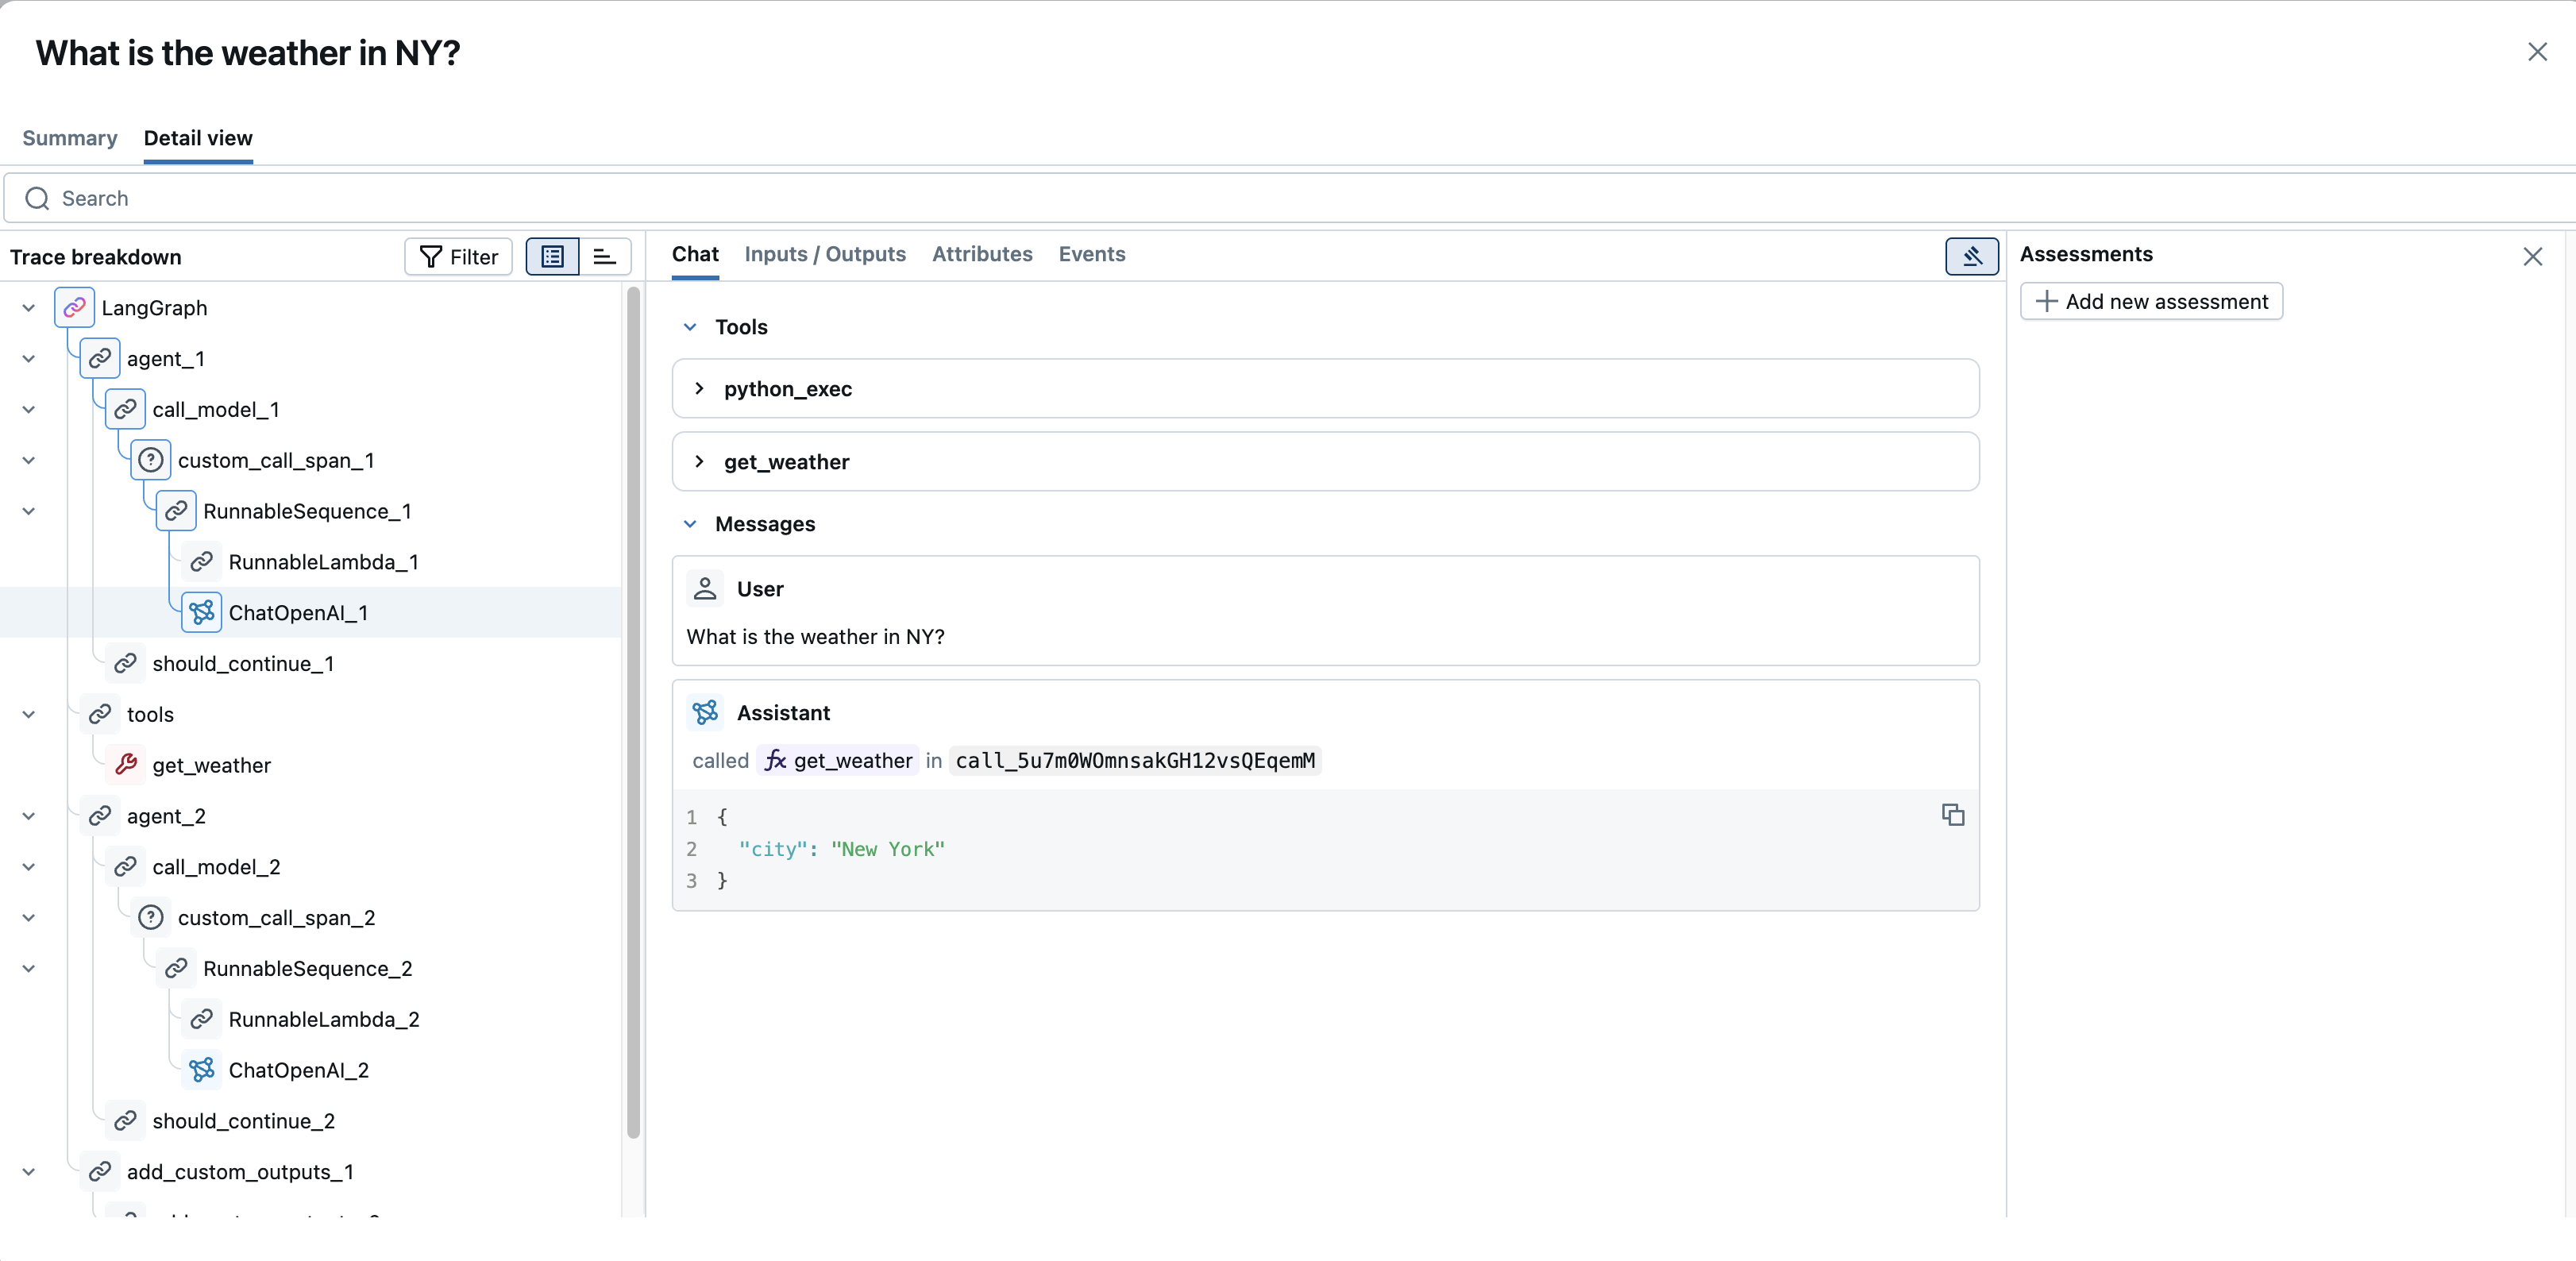
Trace-level information: The view also surfaces trace-level tags and any assessments logged for the entire trace, visible in the Assessments panel when the root span or no span is selected. These can come from direct user feedback or systematic evaluations.
To replace the default tabs with a personalized layout that surfaces only the fields, metrics, and feedback controls you care about, build a custom trace view.
Common debugging scenarios
Use the MLflow Tracing UI to address common debugging and observability needs:
-
Identify slow traces (latency bottlenecks):
- Trace list: Sort by "Execution time" in descending order to bring the slowest traces to the top.
- Detailed view: Open a slow trace and examine the "Trace breakdown" panel. The waterfall display highlights the longest-running operations, which pinpoints bottlenecks in your application's flow.
-
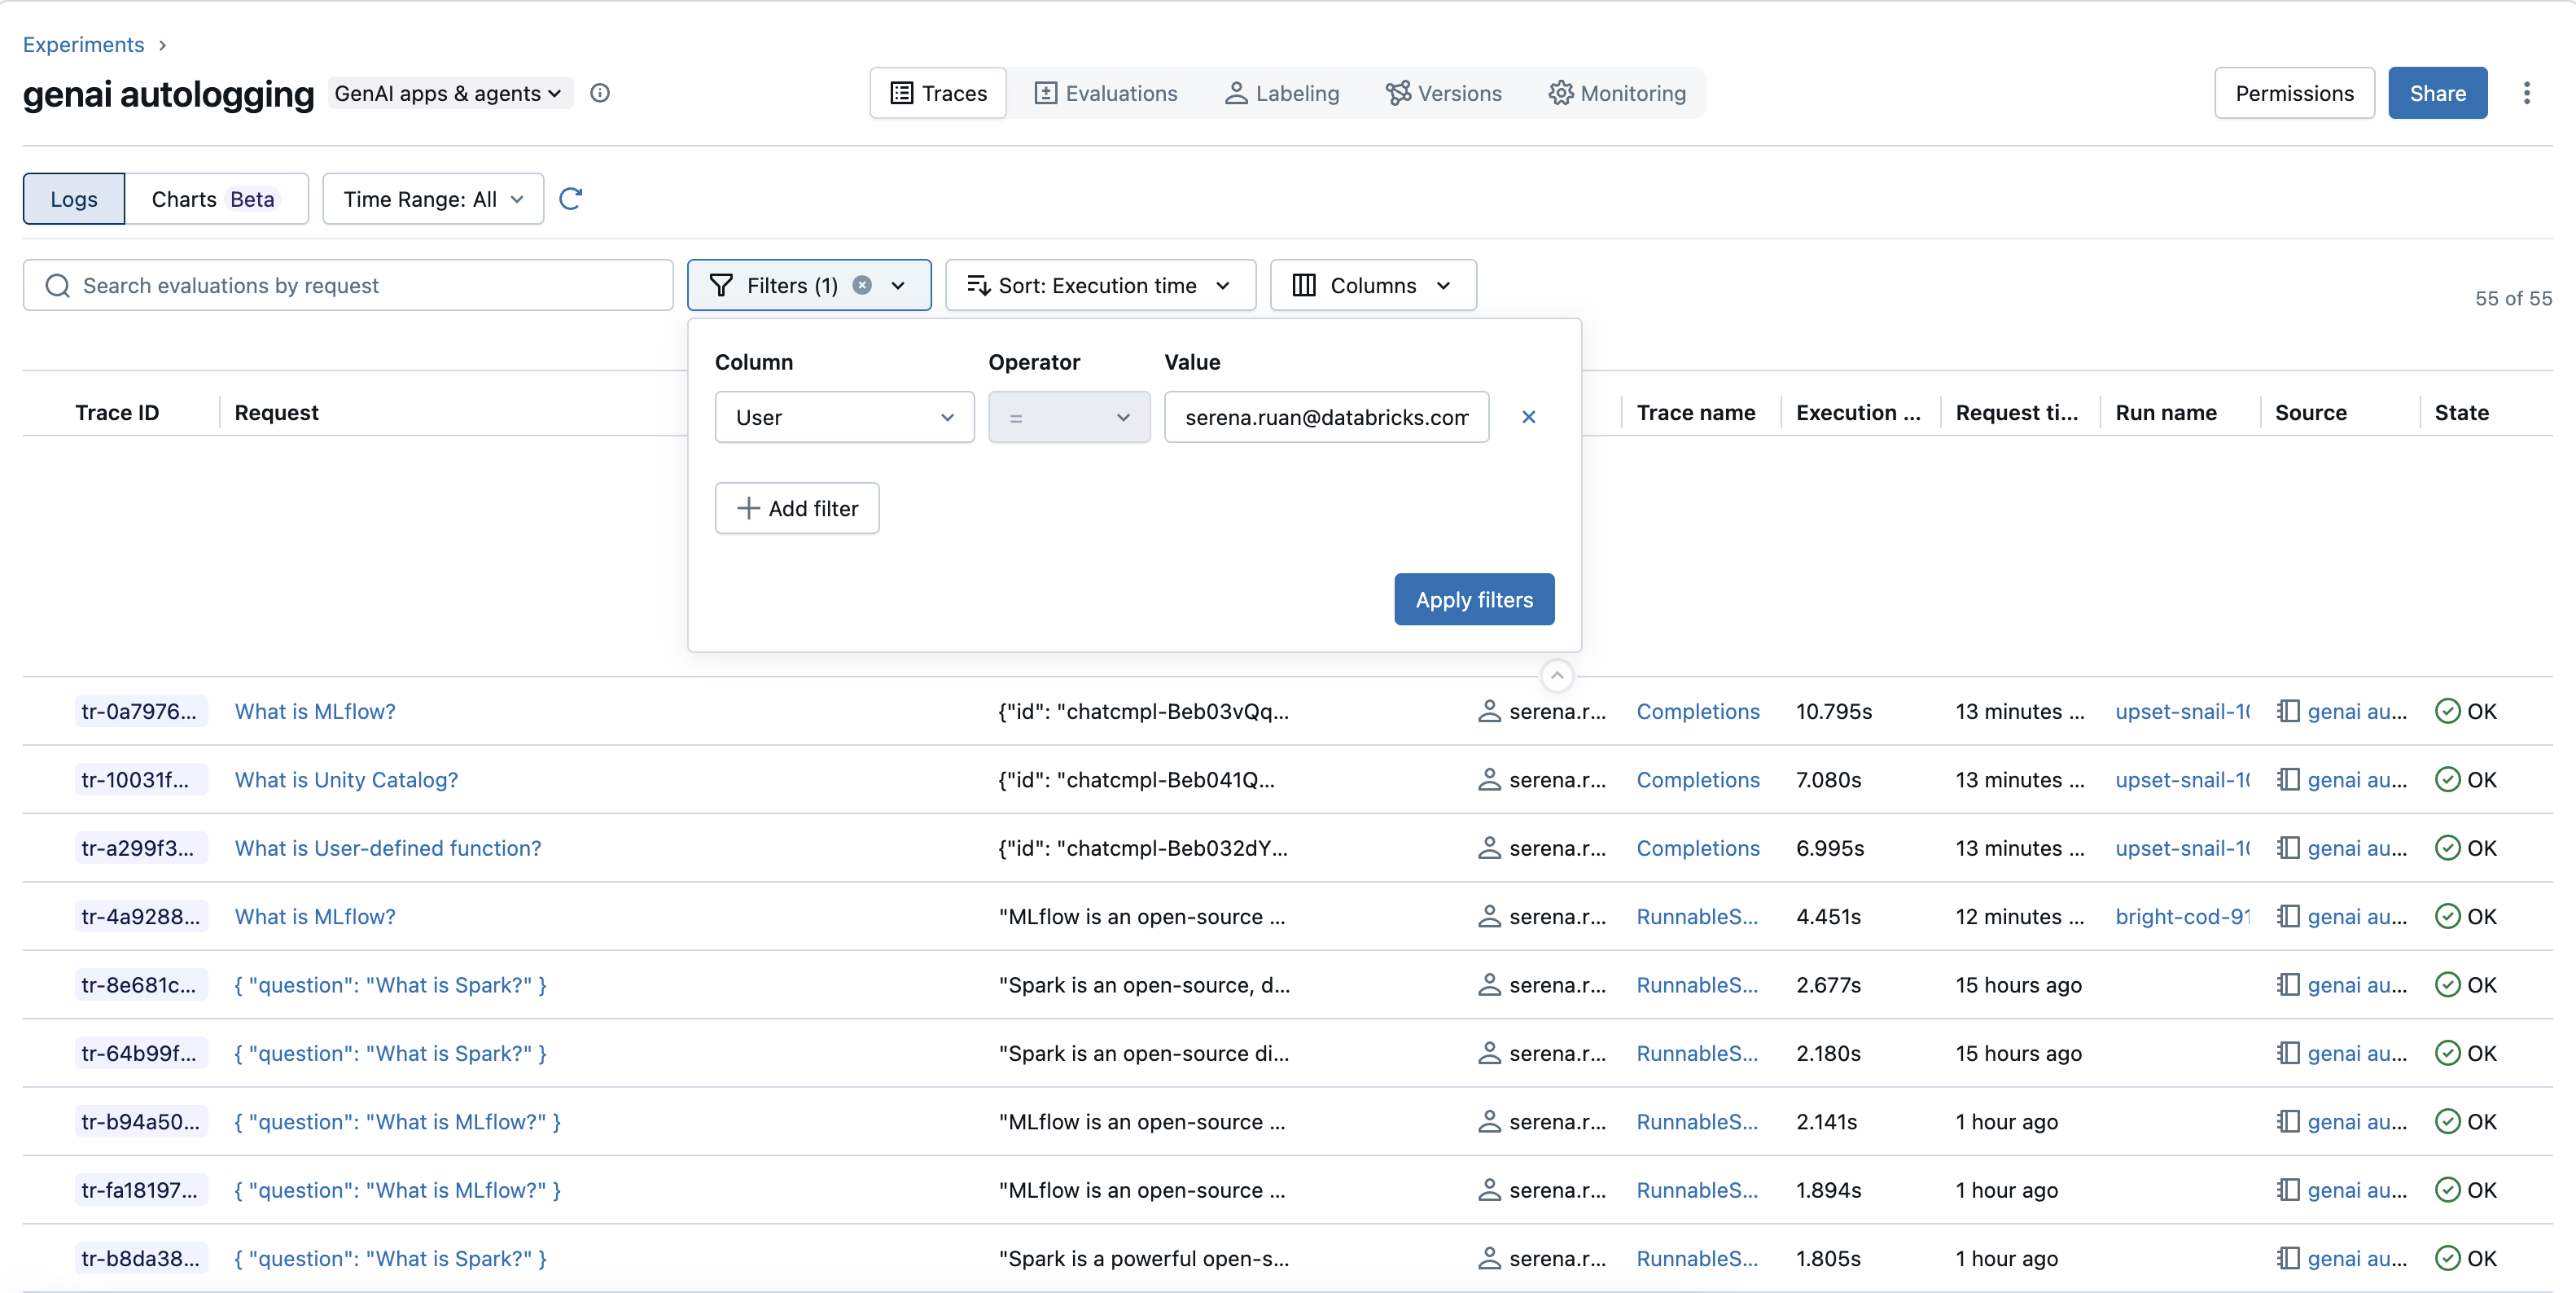
Find traces from a particular user:
- Filters: If you have tracked user information and it is available as a filter (under "Attributes" or a "User" filter), select or enter the user ID.
- Search and tags: If user IDs are stored as tags such as
mlflow.trace.user, search withtags.mlflow.trace.user = 'user_example_123'.
-
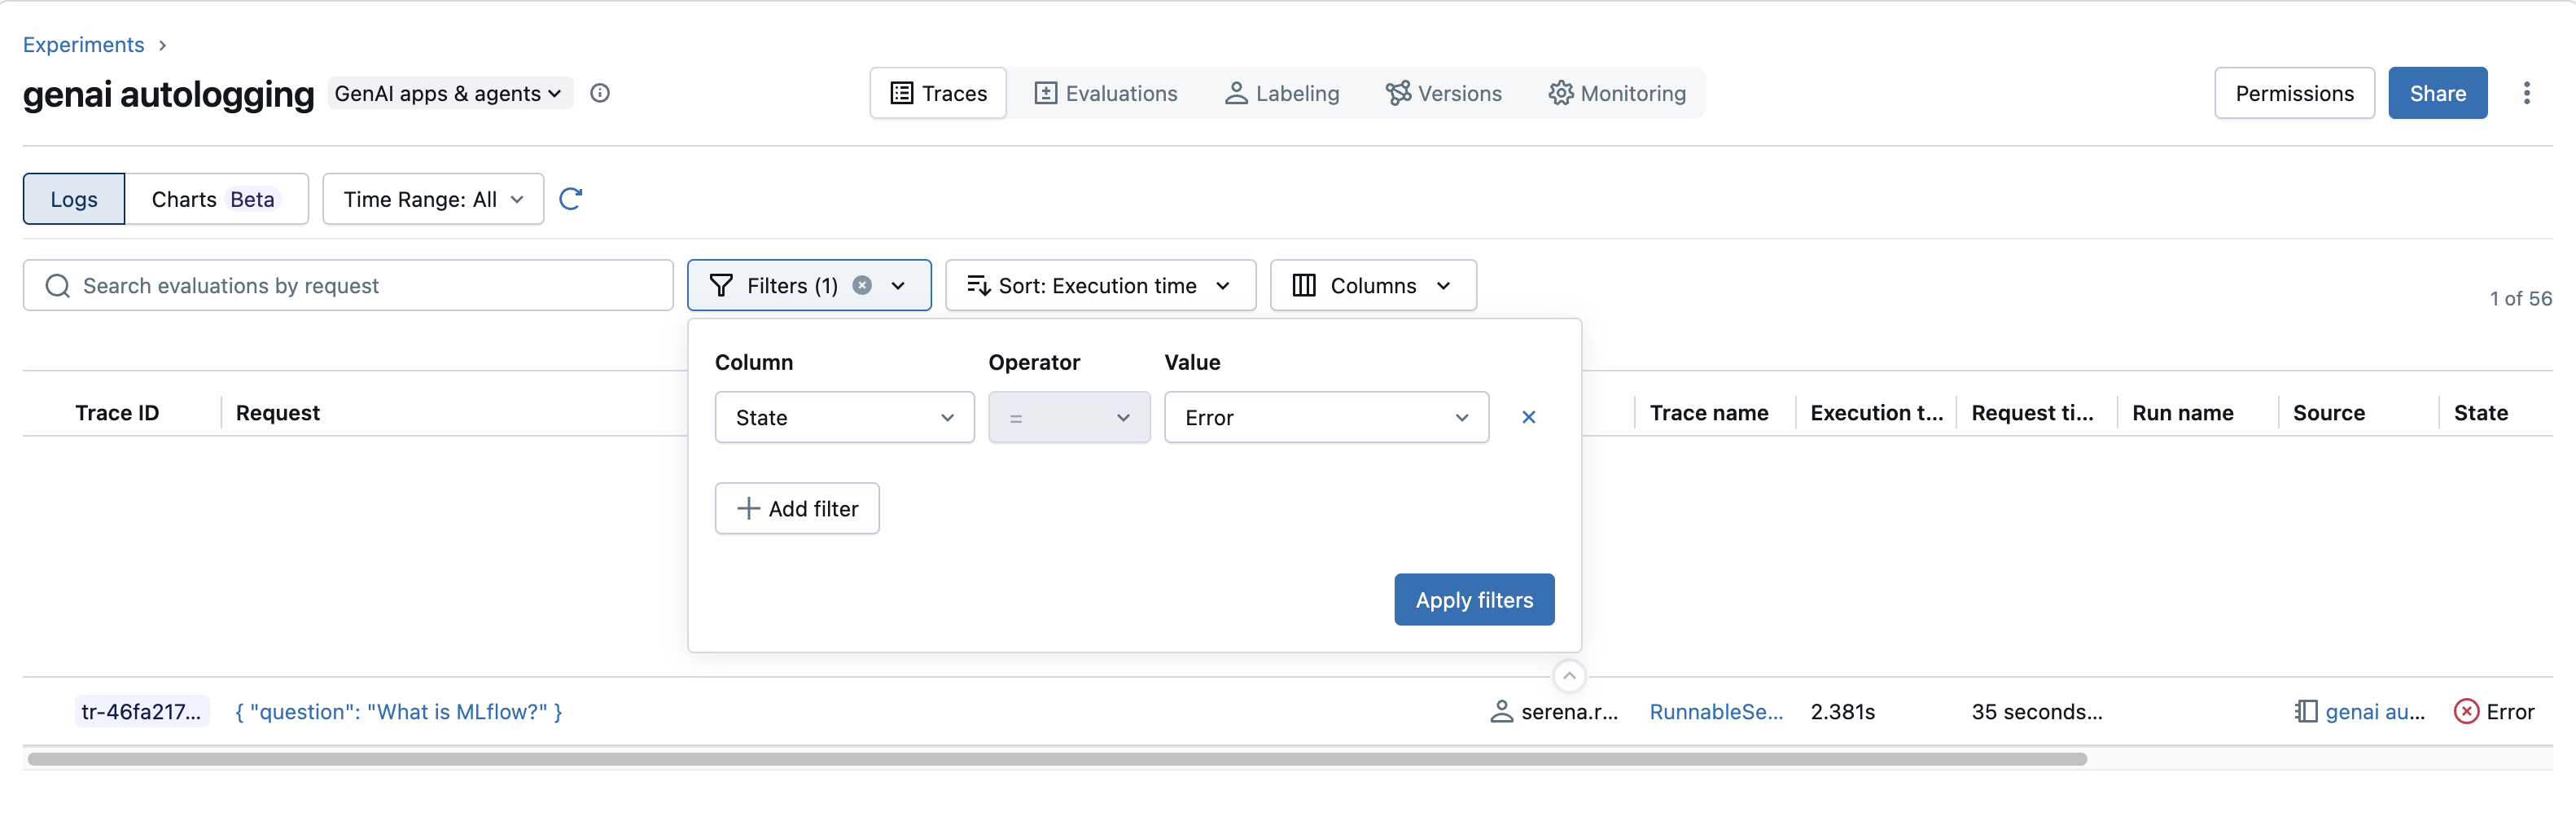
Locate traces with failures (errors):
- Filters: Select the
Stateattribute and chooseERRORto see only traces that failed. - Detailed view: Select the errored span in the "Trace breakdown", then open its "Events" tab to view the exception message and stack trace.
- Filters: Select the
-
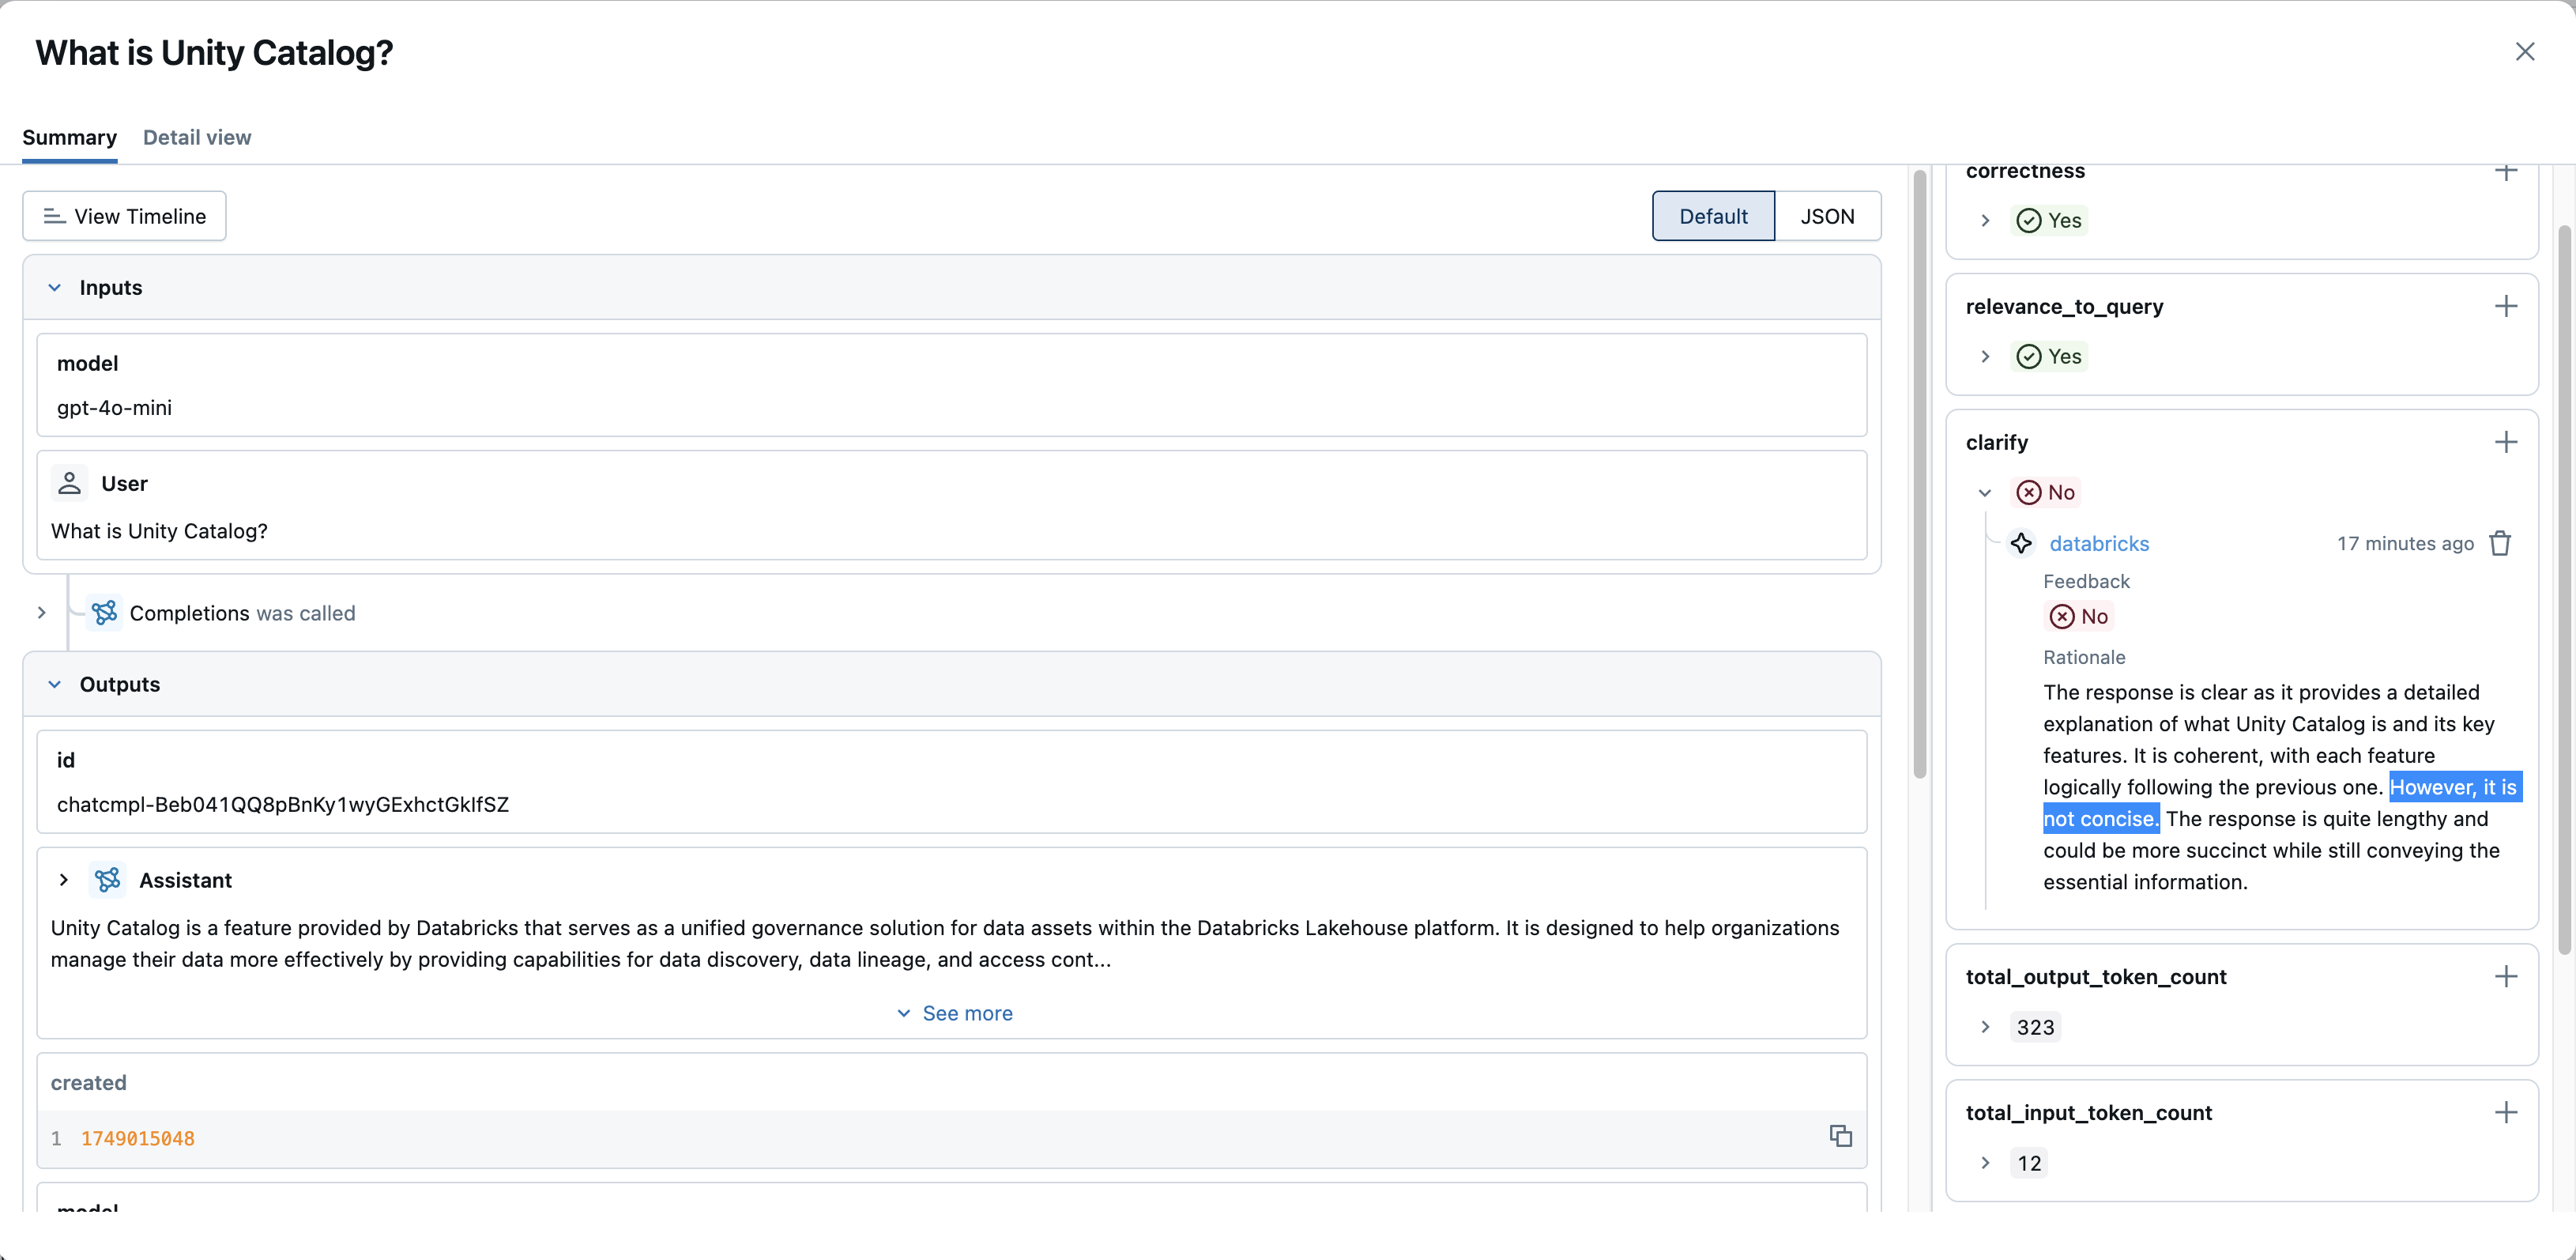
Identify traces with negative feedback or issues:
- Assessment filters: If you collect user feedback or run evaluations that produce assessments (such as a boolean
is_corrector a numericrelevance_score), filter by assessment name and value (for example,is_correct = falseorrelevance_score < 0.5). - View assessments: Open a trace and check the "Assessments" panel or individual span assessments to see logged feedback, scores, and rationales.
- Assessment filters: If you collect user feedback or run evaluations that produce assessments (such as a boolean
Tracing in Databricks notebooks
MLflow Tracing displays traces directly in Databricks notebooks, as part of your development and experimentation workflow.
The MLflow Tracing Databricks Notebook integration is available in MLflow 2.20 and above.
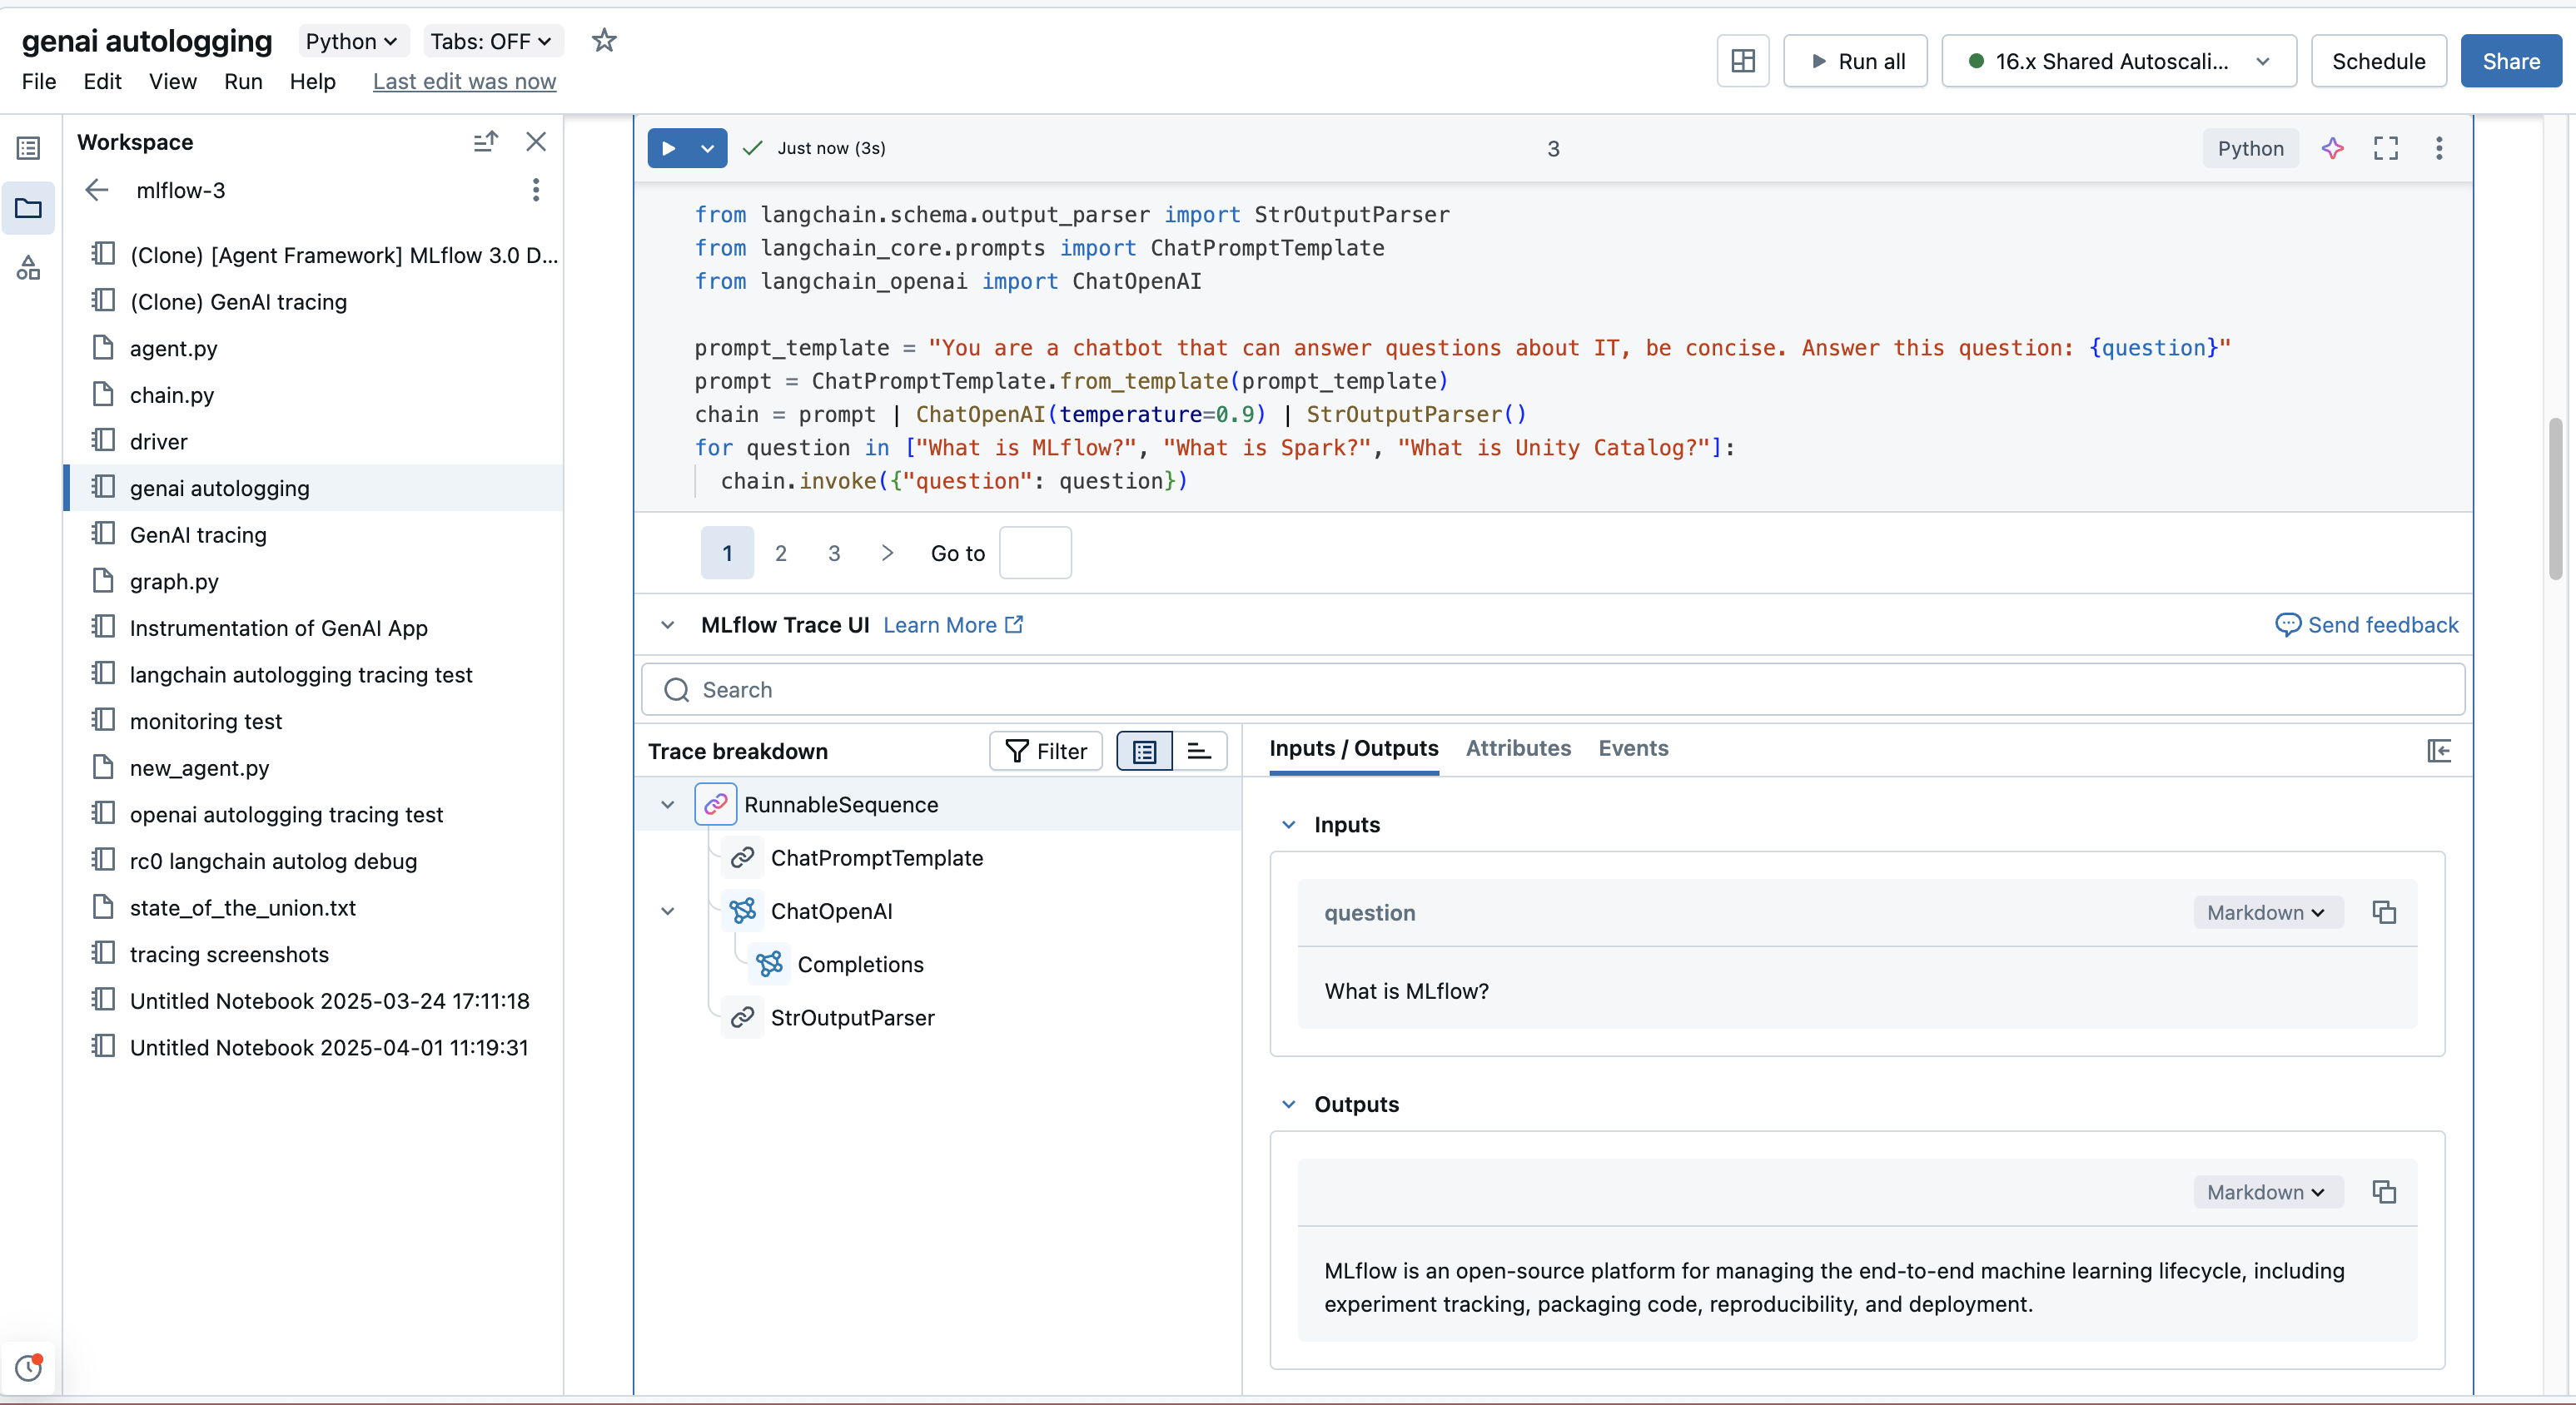
When you work in a Databricks notebook and your MLflow Tracking URI is set to "databricks" (often the default, or set with mlflow.set_tracking_uri("databricks")), the trace UI can display automatically in a cell's output.
This happens when:
- A cell's code generates a trace (for example, by calling a function decorated with
@mlflow.traceor an auto-instrumented library call). - You call
mlflow.search_traces()and display the result. - An
mlflow.entities.Traceobject (for example, frommlflow.get_trace()) is the last expression in a cell or is passed todisplay().
The in-notebook view provides the same trace exploration capabilities as the main MLflow Experiments UI, so you can iterate without switching context.
Control notebook display
To enable or disable the automatic display of traces in notebook cell outputs, run: mlflow.tracing.disable_notebook_display() or mlflow.tracing.enable_notebook_display()
Limitations
- The trace list returns at most 1,000 traces. Filters and trace ID search apply only to this set, not the full experiment, so older traces in large experiments might not appear. To find an older trace, narrow the time range to include it.
- Experiments not in Unity Catalog are capped at 100,000 traces. For scalable, governed storage with no trace limit, Databricks recommends storing traces in Unity Catalog. To move existing experiment traces, migrate to traces in Unity Catalog.
Additional resources
- Build a custom trace view - Create a personalized, reusable trace layout using natural language
- Query and search traces - Programmatically search and analyze traces for custom workflows
- Build evaluation datasets - Select and convert traces into test data for systematic evaluation and quality improvement