Store OpenTelemetry traces in Unity Catalog
Databricks recommends storing MLflow traces in Unity Catalog tables for new and production workloads. Traces are stored in OpenTelemetry (OTel) format and bound to an MLflow experiment, which remains the UI entry point for viewing them. Storing traces in Unity Catalog provides the following benefits:
- Store large volumes of traces in Delta tables for long-term retention and analysis, with no per-experiment trace limit.
- Access control is managed through Unity Catalog schema and table permissions rather than experiment-level ACLs. Users with access to the Unity Catalog tables can view all traces stored in those tables, regardless of which experiment the traces belong to.
- Query trace data directly using SQL through a Databricks SQL warehouse, enabling advanced analytics and custom reporting.
- OTel format ensures compatibility with other OpenTelemetry clients and tools.
Prerequisites
-
A Unity Catalog-enabled workspace.
-
Enable the "Variant Shredding for Optimized Read Performance on Semi-Structured Data" preview. For workspaces with a compliance security profile enabled, you must also enable the "Lakeflow Connect Zerobus Ingest" preview. See Manage Databricks previews.
-
Permissions to create catalogs and schemas in Unity Catalog.
-
A Databricks SQL warehouse with
CAN USEpermissions. Save the warehouse ID for later reference. -
A workspace in a supported region. See Features with limited regional availability.
-
MLflow Python library version 3.14 or later installed in your environment:
Bashpip install mlflow[databricks]>=3.14.0 --upgrade --force-reinstall
Setup: Create an experiment with a Unity Catalog trace location
Run the following code to create and bind an experiment to a Unity Catalog trace location:
# Example values for the placeholders below:
# MLFLOW_TRACING_SQL_WAREHOUSE_ID: "abc123def456" (found in SQL warehouse URL)
# experiment_name: "/Users/user@company.com/traces"
# catalog_name: "main" or "my_catalog"
# schema_name: "mlflow_traces" or "production_traces"
# table_prefix: "my_otel"

import os
import mlflow
from mlflow.entities.trace_location import UnityCatalog

mlflow.set_tracking_uri("databricks")

# Specify the ID of a SQL warehouse you have access to.
os.environ["MLFLOW_TRACING_SQL_WAREHOUSE_ID"] = "<SQL_WAREHOUSE_ID>"
# Specify the name of the MLflow Experiment to use for viewing traces in the UI.
experiment_name = "<MLFLOW_EXPERIMENT_NAME>"
# Specify the name of the Catalog to use for storing traces.
catalog_name = "<UC_CATALOG_NAME>"
# Specify the name of the Schema to use for storing traces.
schema_name = "<UC_SCHEMA_NAME>"
# Specify the name of the prefix appended to every table storing trace data.
table_prefix = "<UC_TABLE_PREFIX>"

# mlflow.set_experiment is an upsert operation
experiment = mlflow.set_experiment(
    experiment_name=experiment_name,
    trace_location=UnityCatalog(
        catalog_name=catalog_name,
        schema_name=schema_name,
        table_prefix=table_prefix,  # defaults to experiment id if not provided
    ),
)

print(f"Experiment ID: {experiment.experiment_id}")
print(experiment.trace_location.full_otel_spans_table_name)
You can also use mlflow.create_experiment with the same trace_location parameter. Unlike set_experiment, create_experiment does not set the active experiment, so you must call set_experiment afterward in order to ensure that traces are routed to the correct location:
experiment_id = mlflow.create_experiment(
    name=experiment_name,
    trace_location=UnityCatalog(
        catalog_name=catalog_name,
        schema_name=schema_name,
        table_prefix=table_prefix,
    ),
)

# trace_location is optional here since
# the experiment is already bound to the UC trace location above.
mlflow.set_experiment(experiment_id=experiment_id)
Once you bind an experiment to a UC trace location, you cannot reassign the experiment to a different UC trace location. However, multiple experiments can share the same UC trace location.
Verify tables
After running the setup code, four new Unity Catalog tables appear in the schema in the Catalog Explorer UI:
<table_prefix>_otel_annotations<table_prefix>_otel_logs<table_prefix>_otel_metrics<table_prefix>_otel_spans
Grant permissions
A Databricks user or service principal needs the following Unity Catalog privileges to write or read MLflow traces from the Unity Catalog tables:
- USE_CATALOG on the catalog.
- USE_SCHEMA on the schema.
- MODIFY and SELECT on each of the
<table_prefix>_<type>tables.
ALL_PRIVILEGES is not sufficient for accessing Unity Catalog trace tables. You must explicitly grant MODIFY and SELECT.
Log traces to the Unity Catalog tables
After creating the tables, you can write traces to them from various sources by specifying the trace location. How you do this depends on the source of the traces.
- MLflow SDK
- Model Serving endpoint
- Third-party OTel client
The Unity Catalog trace location can be specified using the mlflow.set_experiment Python API.
import mlflow

from mlflow.entities.trace_location import UnityCatalog

mlflow.set_tracking_uri("databricks")

# Specify the catalog, schema, and table prefix to use for storing Traces
catalog_name = "<UC_CATALOG_NAME>"
schema_name = "<UC_SCHEMA_NAME>"
table_prefix = "<UC_TABLE_PREFIX>"

# For existing experiments, it is not necessary to specify `trace_location`. MLflow
# retrieves the UC trace location bound to the experiment and routes traces to
# that location.
mlflow.set_experiment(
    experiment_name="...",
    trace_location=UnityCatalog(
        catalog_name=catalog_name,
        schema_name=schema_name,
        table_prefix=table_prefix,
    ),  # optional for existing experiments
)

# Create and ingest an example trace using the `@mlflow.trace` decorator
@mlflow.trace
def test(x):
    return x + 1

test(100)
To write traces from a Databricks model serving endpoint to Unity Catalog tables, you must configure a personal access token (PAT).
- Grant a user or service principal
MODIFYandSELECTaccess to thespansandannotationstables. - Ensure that traces are written using the user or service principal's credentials. If you use a PAT, set the
DATABRICKS_TOKENenvironment variable in the Databricks model serving endpoint's environment variables configuration. If you use OAuth instead, set theDATABRICKS_CLIENT_IDandDATABRICKS_CLIENT_SECRETenvironment variables. - From a Databricks notebook, not from within the serving endpoint, create an experiment with a UC trace location using the
mlflow.set_experimentPython API:
import mlflow

from mlflow.entities.trace_location import UnityCatalog

mlflow.set_tracking_uri("databricks")

# Specify the catalog, schema, and table prefix to use for storing Traces
catalog_name = "<UC_CATALOG_NAME>"
schema_name = "<UC_SCHEMA_NAME>"
table_prefix = "<UC_TABLE_PREFIX>"

# For existing experiments, it is not necessary to specify `trace_location`. MLflow
# retrieves the UC trace location bound to the experiment and routes traces to
# that location.
mlflow.set_experiment(
    experiment_name="...",
    trace_location=UnityCatalog(
        catalog_name=catalog_name,
        schema_name=schema_name,
        table_prefix=table_prefix,
    ),  # optional for existing experiments
)
- Add the experiment ID to the Databricks model serving endpoint's environment variables configuration with
MLFLOW_EXPERIMENT_IDas the environment variable name.
One benefit of storing traces in the OTel format is that you can write to the Unity Catalog tables using third-party clients that support OTel. Traces written this way appear in an MLflow experiment linked to the table as long as they have a root span. The following example shows OpenTelemetry OTLP exporters.
from opentelemetry.exporter.otlp.proto.http.trace_exporter import OTLPSpanExporter

# Span exporter configuration
otlp_trace_exporter = OTLPSpanExporter(
    # Databricks hosted OTLP traces collector endpoint
    endpoint="https://myworkspace.databricks.com/api/2.0/otel/v1/traces",
    headers={
        "content-type": "application/x-protobuf",
        "X-Databricks-UC-Table-Name": "<catalog>.<schema>.<table_prefix>_otel_spans",
        "Authorization": "Bearer MY_API_TOKEN"
    },
)
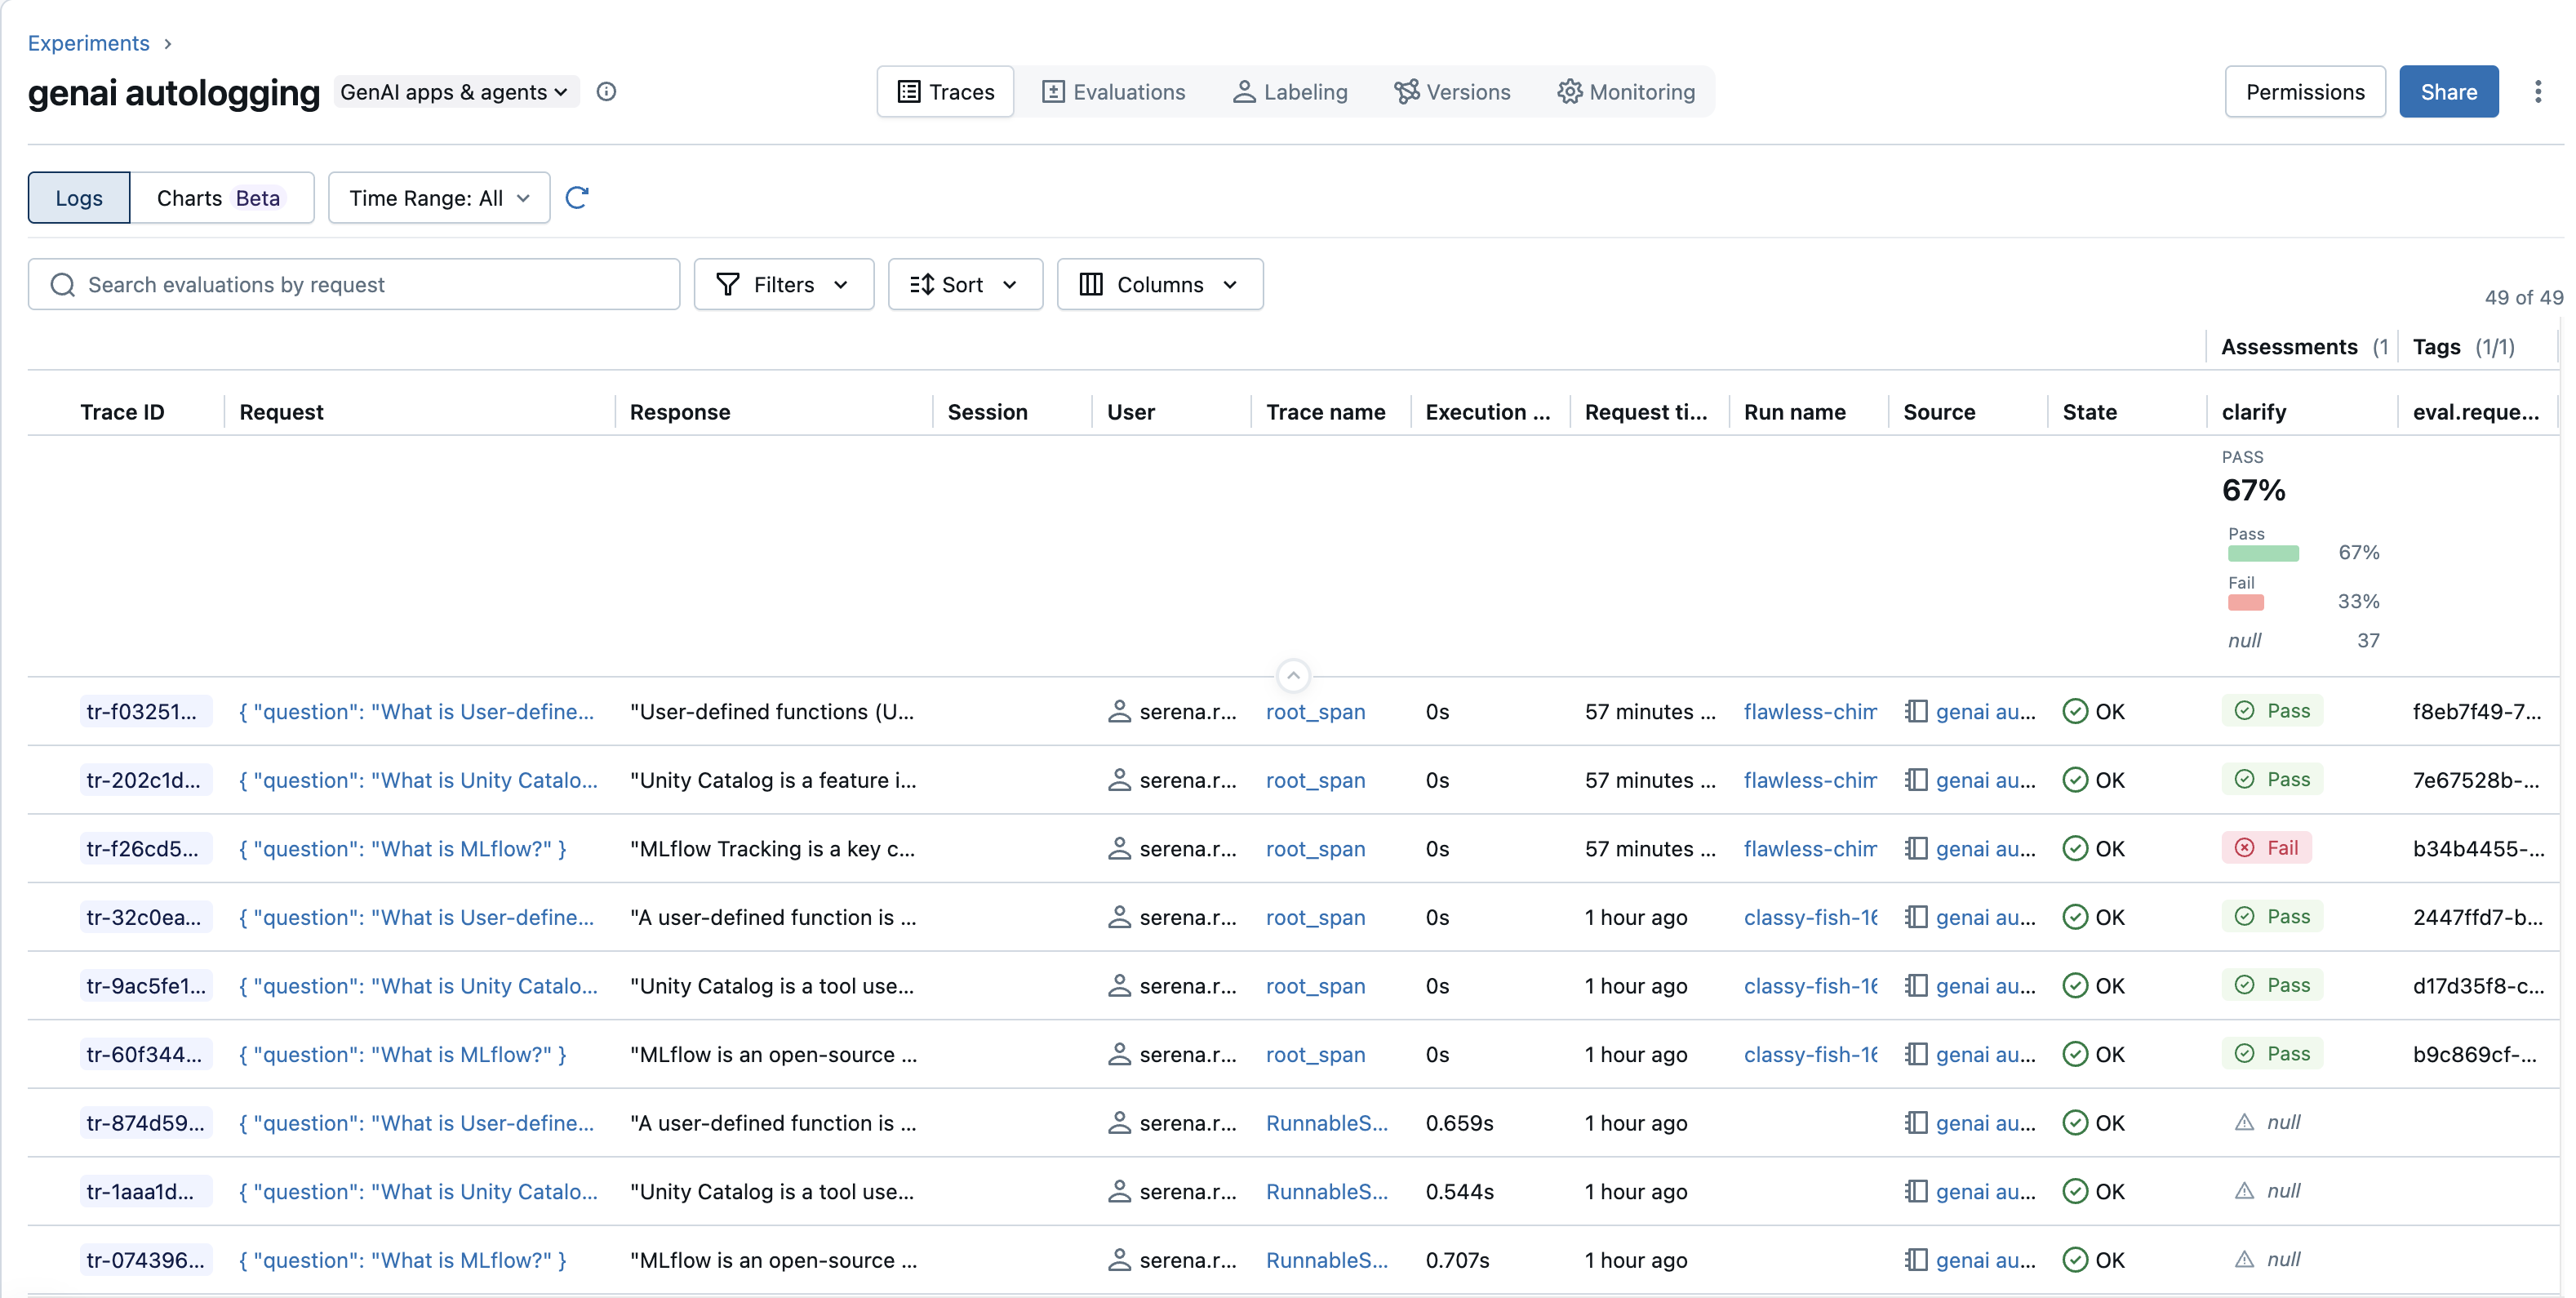
View traces in the UI
View traces stored in OTel format the same way you view other traces:
-
In your Workspace, go to Experiments.
-
Find the experiment where your traces are logged. For example, the experiment set by
mlflow.set_experiment("/Shared/my-genai-app-traces"). -
Click the Traces tab to see a list of all traces logged to that experiment.
-
If you stored your traces in a Unity Catalog table, Databricks retrieves traces using an SQL warehouse. Select a SQL warehouse from the drop-down menu.
For more information on using the UI to search for traces, see View traces in the Databricks MLflow UI.
Enable production monitoring
Production monitoring is a complementary scoring layer that runs scorers against your traces. It works on traces regardless of where they are stored, so you can use it alongside Unity Catalog trace storage.
To use production monitoring with traces stored in Unity Catalog, you must configure a SQL warehouse ID for the experiment. The monitoring job requires this configuration to run scorer queries against Unity Catalog tables.
Set the SQL warehouse ID using set_databricks_monitoring_sql_warehouse_id():
from mlflow.tracing import set_databricks_monitoring_sql_warehouse_id

# Set the SQL warehouse ID for monitoring
set_databricks_monitoring_sql_warehouse_id(
    sql_warehouse_id="<SQL_WAREHOUSE_ID>",
    experiment_id="<EXPERIMENT_ID>"  # Optional, uses active experiment if not specified
)
Alternatively, you can set the MLFLOW_TRACING_SQL_WAREHOUSE_ID environment variable before starting monitoring.
If you skip this step, monitoring jobs fail with an error indicating that the mlflow.monitoring.sqlWarehouseId experiment tag is missing.
To configure monitoring for Unity Catalog traces, you need the following workspace-level permissions:
CAN USEpermission on the SQL warehouseCAN EDITpermission on the MLflow experiment- Permission on the monitoring job (automatically granted when you register the first scorer)
The monitoring job runs under the identity of the user who first registered a scorer on the experiment. This user's permissions determine what the monitoring job can access.
Limitations
-
Trace ingestion is initially limited to 200 traces per second per workspace and 100 MB per second per table. Contact your Databricks account team if you need higher limits.
-
An experiment can only be bound to a Unity Catalog trace location at experiment creation time.
-
Traces stored in Unity Catalog are not supported with Knowledge Assistant or Supervisor Agent.
-
Deleting individual traces is not supported for traces stored in Unity Catalog. To remove traces, you must delete rows directly from the underlying Unity Catalog tables using SQL. This differs from experiment traces, which can be deleted using the MLflow UI or API.
-
Traces cannot yet be written to a default storage catalog.
-
Traces cannot yet be written to storage protected by Private Service Connect.
-
Enabling tracing on a serving endpoint may reduce serving throughput.
Additional resources
- Query OpenTelemetry traces stored in Unity Catalog
- Search for traces by OTel span attributes - Search for third-party OTel traces stored in Unity Catalog by span attributes.
- Migrate legacy Unity Catalog trace tables to the table-prefix format - Migrate traces from the older schema-linked format to the table-prefix format.
- Migrate experiment traces to Unity Catalog - Migrate existing traces to Unity Catalog from experiments that do not use Unity Catalog storage.