Trace concepts
Tracing is an observability technique that captures the complete execution flow of a request through your application. Unlike traditional logging that records isolated events, tracing creates a detailed map of how data flows through your systems and records every operation along the way.
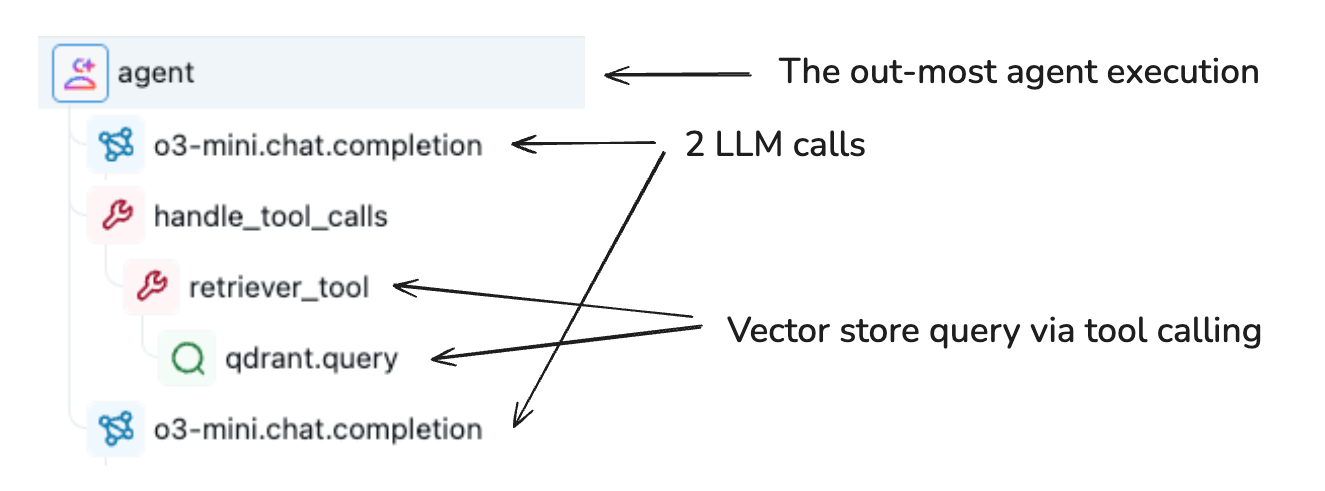
GenAI applications run complex, multi-step workflows that combine multiple components such as LLMs, retrievers, tools, and agents. Tracing makes those workflows debuggable by capturing the full execution flow.
Trace structure
An MLflow Trace comprises two primary objects:
-
Trace.infoof typeTraceInfo: Metadata describing the trace's origin, status, and execution time.TraceInfoalso holds tags. The tags are user-, session-, and developer-provided key-value pairs that you can use to search or filter traces. -
Trace.dataof typeTraceData: The actual payload containing instrumented Span objects that capture your application's step-by-step execution from input to output.

MLflow Traces are compatible with OpenTelemetry specifications, a widely adopted industry standard for observability. Traces remain interoperable with other OpenTelemetry-compatible observability tools, while MLflow extends the OpenTelemetry model with GenAI-specific structures and attributes.
TraceInfo
TraceInfo provides lightweight metadata about the overall trace. Key fields include:
Field | Description |
|---|---|
| Unique identifier for the trace |
| Where the trace is stored: a Unity Catalog trace location (recommended), an MLflow experiment, or a Databricks inference table |
| Start time of the trace in milliseconds |
| Trace status: |
| Duration of the trace in milliseconds |
| JSON-encoded preview of the input (root span input) |
| JSON-encoded preview of the output (root span output) |
| Key-value pairs for filtering and searching traces |
TraceData
The TraceData object is a container of Span objects where the execution details are stored. Each span captures information about a specific operation, including:
- Requests and responses
- Latency measurements
- LLM messages and tool parameters
- Retrieved documents and context
- Metadata and attributes
Spans form a hierarchical structure through parent-child connections, creating a tree that represents your application's execution flow.
Tags
Tags are mutable key-value pairs attached to traces for organization and filtering. MLflow defines standard tags for common use cases:
mlflow.trace.session: Session identifier for grouping related tracesmlflow.trace.user: User identifier for tracking per-user interactionsmlflow.source.name: Entry point or script that generated the tracemlflow.source.git.commit: Git commit hash of the source code (if applicable)mlflow.source.type: Source type (PROJECT,NOTEBOOK, etc.)
You can also add custom tags for your specific needs. Learn more in Add context to traces and Attach custom tags / metadata.
Storage layout
A trace always belongs to an MLflow experiment, but you choose the backend that physically stores the trace data:
- Unity Catalog OTel Delta tables (recommended): For scale and governance, point your experiment at a Unity Catalog trace location. Traces are stored in OpenTelemetry-format Delta tables with no per-experiment limit, governed by Unity Catalog permissions, and queryable with SQL. See Store OpenTelemetry traces in Unity Catalog.
- Managed experiment backend: The default when no Unity Catalog trace location is configured.
TraceInfois stored in a relational database as indexed rows, which enables fast queries for searching and filtering traces.TraceData(the spans) is stored in artifact storage rather than the relational database because spans are larger. This keeps queries fast even when trace volume grows.
Active vs. finished traces
An active trace is a trace that MLflow is currently writing, for example, while a function decorated with @mlflow.trace is running. After the decorated function exits, the trace is finished, but you can still annotate it with new data.
To work with active or recent traces, use these methods:
mlflow.get_active_trace_id(): returns the ID of the currently active trace.mlflow.get_last_active_trace_id(): returns the ID of the most recent finished trace.
Additional resources
- Span concepts - Learn about spans and how they capture individual operations.
- Get started: MLflow Tracing for GenAI (Databricks Notebook) - Get hands-on experience with tracing in a notebook.