Observability
Lakebase gives you built-in views of your Postgres database's metrics and activity: compute and Postgres metrics, running queries, recent query performance, and platform operations. They're available on every project and need no setup.
Metrics and activity
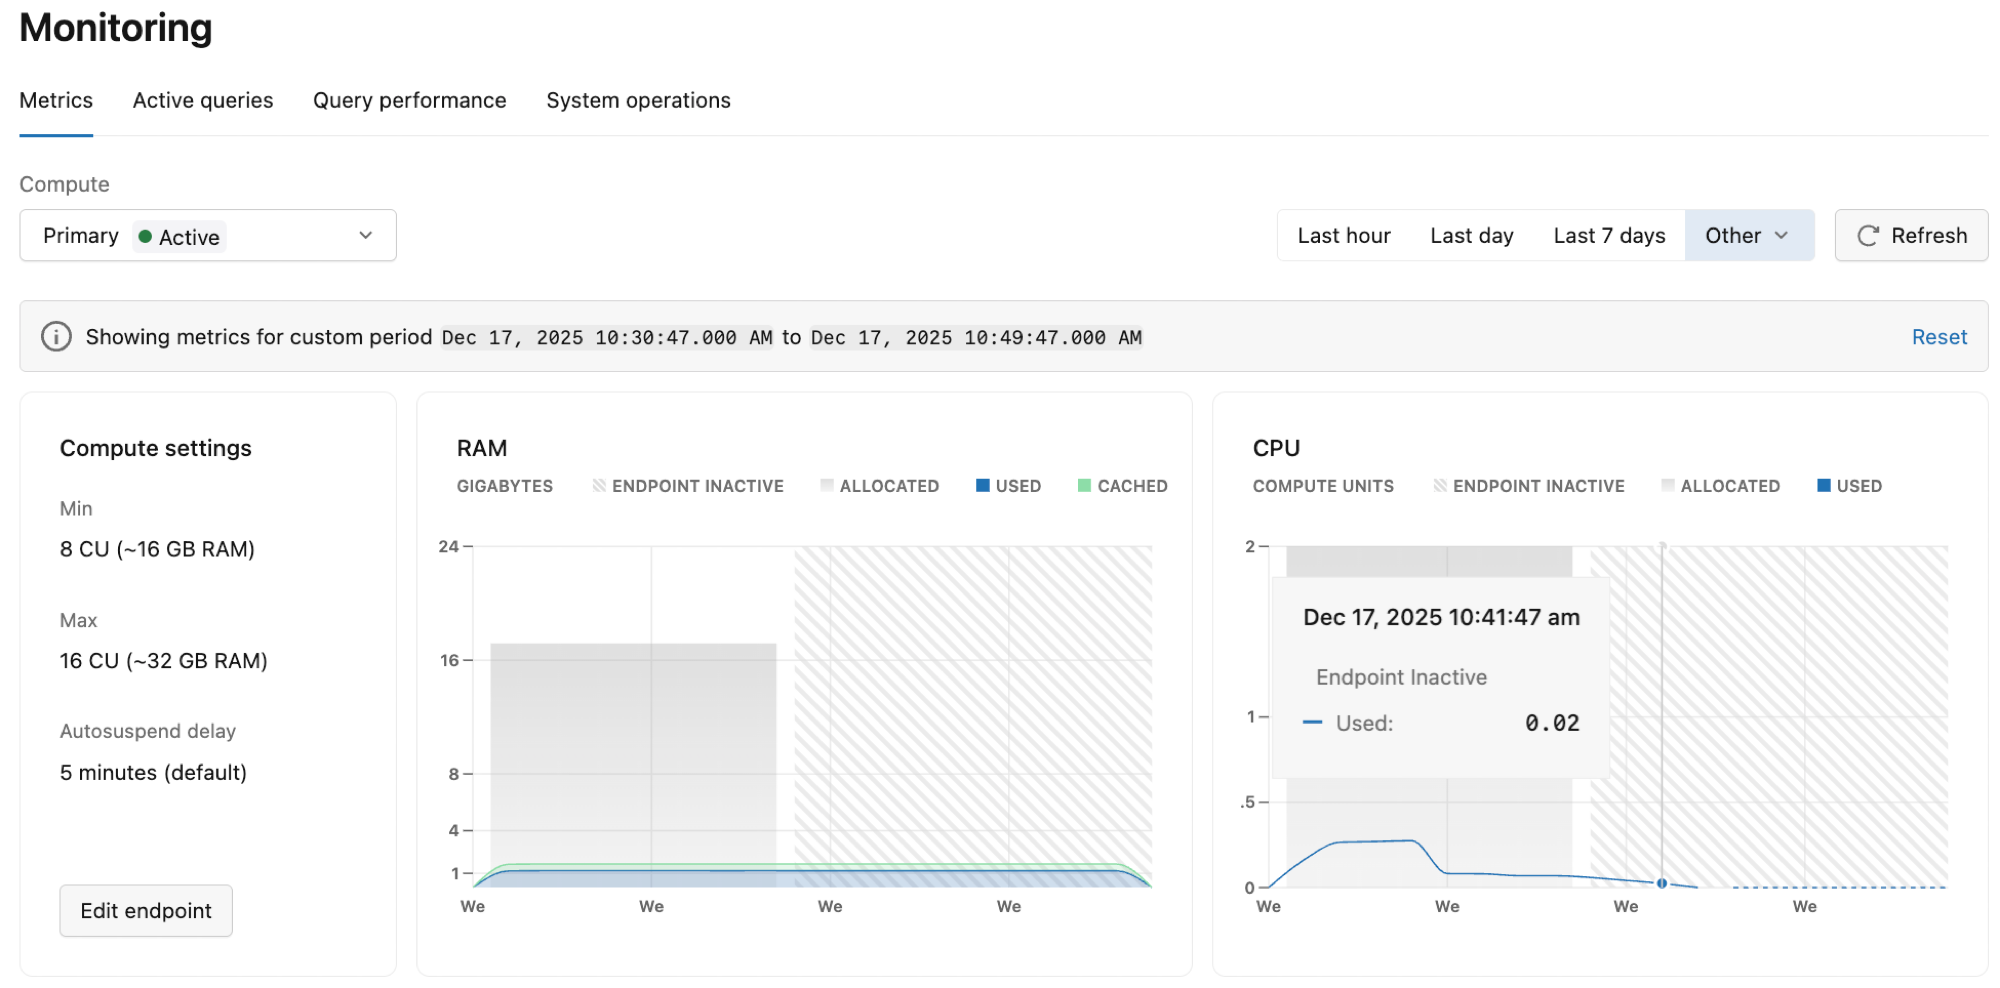
Open a project's Monitoring page in the Lakebase App to see what your database is doing, scoped to the branch and compute you select. These views read your compute's metrics and Postgres's own statistics directly. Metrics graphs go back up to seven days, while the query views reset when a compute suspends.
-
- Metrics
- Graphs of a compute's RAM, CPU, connections, database size, cache, and more, over a selected time period.
-
- Active queries
- The queries running right now, from
pg_stat_activity. Sort by duration to find long-running operations.
-
- Query performance
- The top 100 recent queries by calls and execution time, from
pg_stat_statements, grouped by normalized statement.
-
- System operations
- A log of platform actions on the project: starting and suspending compute, creating branches, applying config.