Evaluate vector search retrieval quality
This feature is in Beta. Workspace admins can control access to this feature from the Previews page. See Manage Databricks previews.
Vector Search provides built-in retrieval quality evaluation that measures and compares the relevance of different search strategies on your data. You can automatically generate evaluation queries from your documents, run multiple retrieval strategies, and generate a detailed report.
Requirements
A managed Delta Sync vector search index. See Create vector search endpoints and indexes.
Permissions
The evaluation job and results dashboard inherit Unity Catalog permissions from the vector search index. Any user with query access to the index can start an evaluation run and view the results dashboard. The user who starts the evaluation run is the owner of the job, not the owner of the index.
How vector search retrieval quality evaluation works
The evaluation runs a four-stage pipeline on your data:
- Generate queries: The system samples documents from your source table and uses an LLM to generate realistic search queries. It generates a mix of natural language queries and keyword queries.
- Search across strategies: Each generated query runs against your index using multiple retrieval strategies, including ANN, hybrid, and full-text. Each strategy is also evaluated with and without the reranker. This approach compares strategies side-by-side on the same query set. For more information about each retrieval strategy, see Retrieval algorithms.
- Score relevance: An LLM judge evaluates every query and retrieved document pair on a 4-point relevance scale.
- Compute metrics and analyze: The system computes retrieval quality metrics with confidence intervals. Results are persisted so you can view them later or compare across evaluation runs.
Start a retrieval quality evaluation run
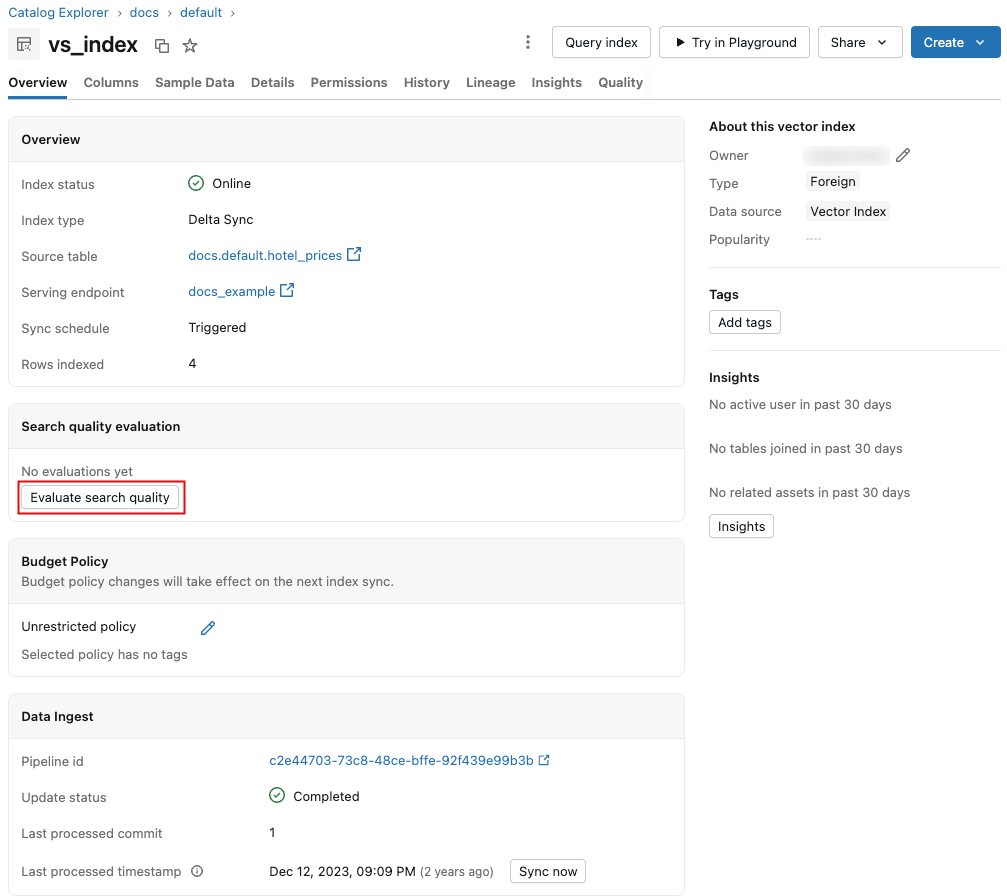
To start the process, click Evaluate search quality on the vector search index page. No configuration is required, as default values are pre-populated based on your index metadata.
When the run completes, click View results to display the results dashboard. For an overview of the dashboard, see Results dashboard.
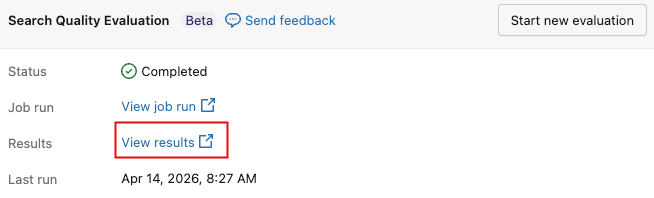
To initiate a new evaluation at any time, click Start new evaluation.
Results dashboard
The dashboard presents the results of the evaluation runs. Use the Select Run drop-down menu to select the run to display.
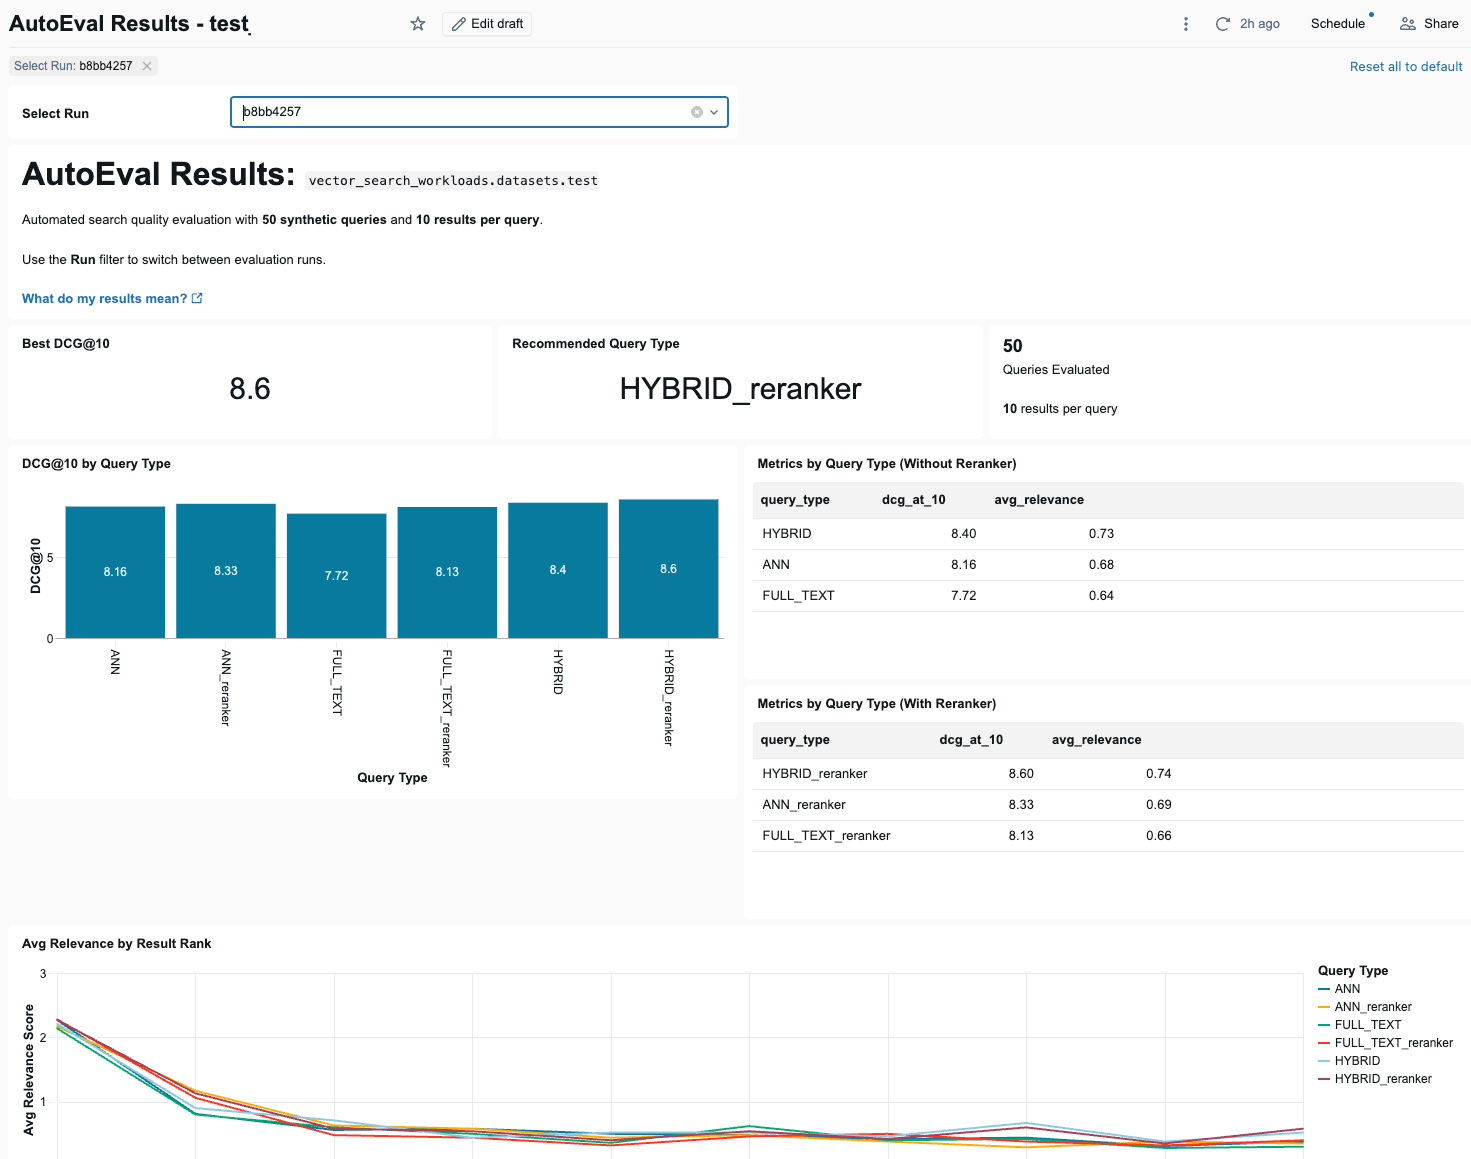
At the top of the dashboard are 3 summary indicators: the best DCG@10 score across all query types, the recommended query type that achieved it, and the number of queries evaluated.
See Why Databricks recommends DCG@10.
Below the summary indicators, the dashboard shows a bar chart that compares DCG@10 scores for each query type, with and without using the reranker. Next to the bar chart are two tables showing DCG@10 and average relevance for each query type, with and without the reranker.
Following that is a line chart showing how average relevance changes across result positions for each query type.
The dashboard also presents the highest and lowest performing queries by average relevance score, a table comparing base and reranker performance for each query type, a table of failed queries (queries where the top-1 result was scored 0 (irrelevant)), and a line chart that shows a selected metric across evaluation runs over time, by query metric.
Relevance scoring
Retrieval quality evaluation uses an LLM-as-judge to score each query and retrieved document pair on a 4-point graded relevance scale:
Score | Label | Description | Example |
|---|---|---|---|
3 | Highly Relevant | Document directly answers the query or provides exactly the information sought | Query: "how do I calculate the area of a rectangle?" Document explains the length × width formula |
2 | Relevant | Document is related and provides useful information, but may not fully answer the query | Query: "where is the routing number on a check?" Document says "printed at the bottom of a check" (partially complete) |
1 | Partially Relevant | Document mentions the topic but doesn't provide useful information for the query | Query: "how to calculate area of a rectangle?" Document discusses area of rectangles in general terms only |
0 | Not Relevant | Document is unrelated to the query, or the document language doesn't match the query language | Query in English Document answers correctly but in French |
Compared to a binary relevant/not relevant scale, the graded scale captures important distinctions. For example, a document that directly answers a question (score 3) is meaningfully different from one that merely touches on the topic (score 1). This granularity flows through to the metrics, particularly DCG, which weights higher-quality results more heavily.
All metrics include 95% confidence intervals computed across per-query values, so you can assess whether differences between strategies are statistically meaningful.
Retrieval metrics
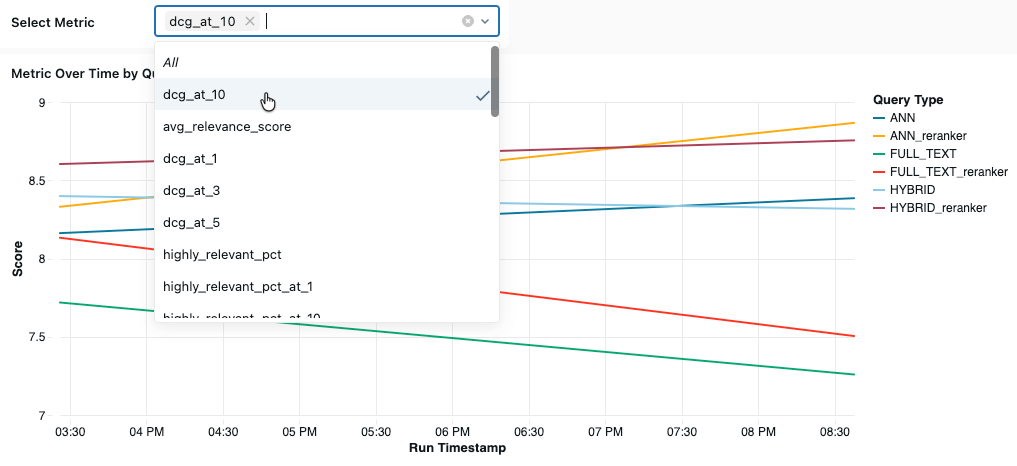
At the bottom of the dashboard, you can view a selected metric over time. Select the metric to display from the Select Metric drop-down menu.
This section describes the available metrics.
DCG@k — Discounted Cumulative Gain
DCG@10 captures both how relevant results are and where they appear in the ranking, using the full 0–3 relevance scale. Databricks recommends using DCG@10 as the primary metric for evaluating overall retrieval quality.
- What it measures: The total utility of the top-10 results, weighted by position. Higher-ranked results contribute more than lower-ranked ones.
- How it works: Each result contributes a gain of
2^relevance - 1, weighted by a logarithmic discount based on its position. Using2^relevance - 1(rather than the raw relevance score) emphasizes highly relevant results: a score-3 result contributes 7, while a score-1 result contributes 1. The first result contributes its full gain, while lower-ranked results contribute progressively less. - Range: 0 to the theoretical maximum shown in the following table. Higher is better.
Theoretical maximum DCG values, if every result scores 3:
k | Theoretical Max DCG |
|---|---|
1 | 7.00 |
3 | 14.92 |
5 | 20.64 |
10 | 31.80 |
20 | 49.28 |
To put these numbers in perspective: if all 10 results have a relevance of 2 (on a scale of 0–3), DCG@10 is 13.63. In this scenario, a 1-point DCG@10 gain is a meaningful (+7% relative) improvement. You can think of it as roughly one result on the page getting noticeably better, weighted toward the top.
NDCG@k — Normalized Discounted Cumulative Gain
- What it measures: How well results are ordered relative to the best possible ordering. NDCG normalizes DCG by dividing it by the ideal DCG (the DCG if results were sorted in descending order of relevance).
- Range: 0 to 1. A score of 1.0 means results are in perfect order.
- When to use: When you want to know if the system is ranking results correctly, independent of the total number of relevant documents available. See Why DCG@10 is the recommended primary metric for a detailed comparison.
Recall@k
- What it measures: The fraction of known relevant documents that appear in the top-k results.
- Range: 0 to 1. A score of 1.0 means all known relevant documents were retrieved.
- When to use: When completeness is important, such as in RAG applications where missing a relevant document means the LLM generates an incomplete answer.
Precision@k
- What it measures: The fraction of top-k results that are relevant (relevance score >= 2).
- Range: 0 to 1. A score of 1.0 means every result in the top k is relevant.
- When to use: When result quality matters more than completeness, such as in search interfaces where irrelevant results might negatively affect user trust.
Average relevance score
- What it measures: The mean LLM-judged relevance score across all query and result pairs.
- Range: 0 to 3. Higher is better.
- When to use: As a quick quality snapshot.
Relevance distribution
- What it measures: The percentage of results in each relevance category:
- Highly Relevant %: Results scoring 3 (direct answers).
- Relevant+ %: Results scoring 2 or higher (useful).
- Not Relevant %: Results scoring 0 or 1 (not useful).
- When to use: To understand the shape of quality distribution. Two strategies can have the same average score but very different distributions. For example, a bimodal distribution (many 3s and many 0s) might suggest that a query pattern isn't being retrieved well and needs attention.
MRR — Mean Reciprocal Rank
- What it measures: How quickly users find the first relevant result. MRR is the average of 1/rank across queries, where rank is the position of the first relevant result (score >= 2).
- Range: 0 to 1. A score of 1.0 means the first result is always relevant.
- When to use: When the top result matters most, such as in question-answering systems.
MAP@k — Mean Average Precision
- What it measures: The quality of ranking across all relevant results, not just the first one. MAP computes precision at each relevant result's position, then averages.
- Range: 0 to 1. Higher values indicate relevant documents are consistently ranked near the top.
- When to use: When you need a single number that captures overall ranking quality across all relevant documents.
Why DCG@10 is the recommended primary metric
DCG@10 provides the most complete picture of retrieval quality for most applications:
- Graded relevance captures nuance: Binary metrics like precision treat all relevant documents equally. A document that perfectly answers the query (score 3) counts the same as one that vaguely mentions the topic (score 1). DCG uses the full 0–3 relevance scale, so a result scored 3 contributes significantly more than a result scored 1.
- Position matters: Users look at top results first. DCG applies a logarithmic discount, so that results at position 1 count much more than results at position 10. The first result contributes its full relevance score, while the 10th result's contribution is divided by log₂(11) ≈ 3.46.
- Absolute utility reveals what normalized metrics miss: Consider the example shown in the following table. Both result sets achieve a perfect NDCG of 1.00 because each has results in ideal descending order. However, Result Set B delivers nearly twice the total value (DCG 8.02 vs 4.26) because every result is useful. NDCG cannot distinguish between "perfect ranking of 2 good results among 3 irrelevant ones" and "perfect ranking of 5 good results." DCG answers the question: "How much useful information did the user actually get?"
For more information about DCG and NDCG, see Discounted cumulative gain.
Results | Position 1 | Position 2 | Position 3 | Position 4 | Position 5 | NDCG@5 | DCG@5 |
|---|---|---|---|---|---|---|---|
Result set A | 3 | 2 | 0 | 0 | 0 | 1.00 | 4.26 |
Result set B | 3 | 3 | 3 | 2 | 2 | 1.00 | 8.02 |
No single metric tells the whole story. Use the full metrics suite for a complete picture and select the metric that best matches your application's quality requirements.
Common scenarios
The following table explains common evaluation result patterns, what they mean, and how to address them:
Pattern | What it means | Suggested action |
|---|---|---|
Hybrid significantly better than ANN | Queries benefit from keyword matching. | Use hybrid search in production. |
ANN approximately equal to hybrid | Keywords aren't adding value for your data. | Either strategy works. ANN is simpler. |
Full-text significantly better than ANN | Embeddings may not capture your domain well. | Consider fine-tuning your embedding model or using full-text search. |
Reranker improves metrics significantly | Cross-encoder provides meaningful quality lift. | Enable reranker if latency budget allows. |
Wide confidence intervals | Not enough queries for reliable comparison. | Increase the number of evaluation queries. |
All strategies score low | Data quality or relevance issues. | See Vector search retrieval quality guide for a step-by-step guide to improving retrieval quality. |