AI/BIダッシュボードでのカスタム可視化
プレビュー
この機能は パブリック プレビュー段階です。
カスタム可視化により、AI/BI ダッシュボードで組み込みの可視化の種類を超えてチャートをカスタマイズできます。カスタム視覚化では、JSON仕様からチャートをレンダリングするために、Vega-Liteライブラリを使用します。
カスタム可視化では、組み込みオプションの範囲を超える特殊なチャートタイプをレンダリングできます。次の系統樹は、フォースディレクテッド・Layoutを使用して、関連するレコードを共有グループおよびファミリーの中心の周囲にグループ化します。
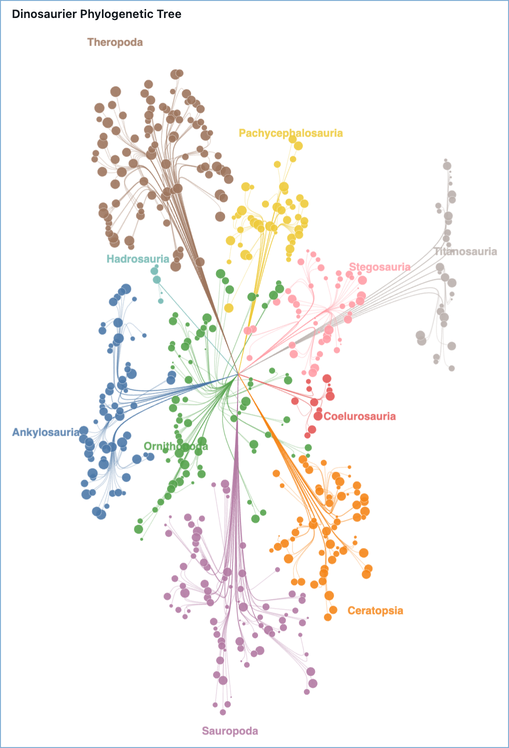
チャートを段階的に構築するには、可視化の例を参照してください。他のチャートタイプの仕様を参照するには、その他のチャート仕様を参照してください。
カスタムビジュアライゼーションを作成
カスタムビジュアライゼーションを作成するには:
- データセットを選択。
- 視覚化構成ペインで、 詳細 な視覚化セクションの下にある カスタム可視化 を選択します。
- フィールド セクションで、使用するフィールドを追加してください。各フィールドには一意の 名前 があります。これらの名前を使用して、Vega-Lite仕様のフィールドを参照します。
- Vega-Lite JSON仕様を Vega-Lite 仕様 エディターに入力してください。
参照データセット列
次のいずれかの方法で、Vega-Lite 仕様の列を参照します。
-
"field": "{columnName}"を使用してください。以下の例では、xField列をX軸に割り当てます。JSON"encoding": {
"x": { "field": "xField", "type": "quantitative" }
} -
式では、
datum["{columnName}"]またはdatum.{columnName}を使用してください。次の例では、rおよびangle列から新しいx列を定義します。JSON{ "calculate": "datum.r * cos(datum.angle)", "as": "x" }
詳細については、Vega expressions ドキュメントの「datum」を参照してください。
ダッシュボードテーマを引き継ぐ
カスタムビジュアライゼーションは、ライトモードとダークモードを含むダッシュボードのテーマに自動的に適応します。次のグラフ要素は、指定を変更することなくテーマの値を継承します。
- 軸、凡例、タイトル、およびヘッダーのフォントは、ダッシュボードで設定されたフォントと一致します。
- 軸のグリッド線は、アクティブモードのダッシュボードのグリッド線の色と一致します。
- チャートの背景は、ウィジェットのテーマ背景に重なって透明です。
仕様のconfigブロックで定義する設定は、継承されたデフォルトよりも優先されます。
式でテーマ値を参照する
テーマ対応の値でマークのスタイルを設定するには、Vega-Lite 式 ({ "expr": "..." }) 内で次のシグナルを参照してください:
信号 | 説明 |
|---|---|
| アクティブ モード用の事前解決済みカラー トークン。 |
| アクティブなカラーモード、 |
| ダッシュボードの所有者によって構成された完全なテーマで、フォント ( |
colors 信号と dashboardTheme 信号は独立しています。colors 信号はアクティブモード用に解決された便利なトークンを提供し、dashboardTheme は所有者が構成した完全なテーマを公開します。最初に colors を使用し、フォント、フルパレット、または colors が提供しない値には dashboardTheme を使用します。
次の例は、テーマ値を参照する方法を示しています。
-
ダッシュボードの本文フォントをテキストマークに使用します。
JSON{ "expr": "dashboardTheme.resolvedFontSettings.fieldValue.fontFamily" } -
アクティブモードにはダッシュボードのタイトル色を使用します:
JSON{ "expr": "dashboardTheme.resolvedFontSettings.fieldTitle.fontColor[mode]" } -
ダッシュボードのカテゴリパレットから色を使用します。
JSON{ "expr": "dashboardTheme.visualizationColors[0]" }
colors トークンは、アクティブモードに対してすでに解決されています。[mode] インデックスをスキップし、colors.markHighlightColor[mode] ではなく colors.markHighlightColor を使用してください。dashboardTheme.gridLineColor[mode] のようにモードごとのバリアントを持つ dashboardTheme 下のフィールドには、[mode] インデックスが必要です。
選択時に他のウィジェットをフィルター
カスタム可視化はクロスフィルターのソースとして機能します。ユーザーがマークをクリックすると、選択によってダッシュボードの他のウィジェットがフィルターされます。これを有効にするには、予約済みの名前「databricks_mark_selection」を持つ点選択パラメーターを追加します。レンダラーはこの名前を検出し、選択内容をダッシュボードのクロスフィルターの状態に接続します。
"params": [
  {
    "name": "databricks_mark_selection",
    "select": { "type": "point", "fields": ["categoryName"] }
  }
]
次の要件が適用されます:
- パラメーター
nameは厳密にdatabricks_mark_selectionである必要があります。その他の名前は通常のパラメーターとして扱われ、クロスフィルターを駆動しません。 select.typepointである必要があります。区間 (ブラシ) 選択は、クロスフィルターソースとしてサポートされていません。select.fieldsウィジェット構成の**フィールド**セクションで定義されているフィールド名をリストする必要があり、生の列名ではありません。select.fieldsにディメンション (グループ化) フィールドのみをリストします。SUM(...)やAVG(...)のような集計メジャーでは、クロスフィルターを適用できません。- 複数のフィールドを選択するには、それらをまとめてリストします:
"fields": ["categoryName", "regionName"]。
選択したマークをハイライト表示
選択したマークを強調表示するには、stroke および strokeWidth 条件を塗りつぶしベースのマーク(たとえば、bar、arc、または rect)に使用し、color エンコードをフィールドにバインドしたままにします。ライトモードとダークモードの両方でハイライトが判読可能になるように、ストロークには{ "expr": "colors.markHighlightColor" }を使用します。
次の例では、バーがクリックされたときに、ダッシュボードの残りの部分をcategoryNameでフィルターします。選択されたバーにはテーマに沿ったストロークが適用され、選択されていないバーは色エンコーディングを維持しながら薄暗くなります。
JSON仕様
{
  "$schema": "https://vega.github.io/schema/vega-lite/v6.json",
  "data": { "name": "databricks_query" },
  "width": "container",
  "height": "container",
  "config": { "autosize": { "type": "fit", "contains": "padding" } },
  "params": [
    {
      "name": "databricks_mark_selection",
      "select": { "type": "point", "fields": ["categoryName"] }
    }
  ],
  "mark": { "type": "bar", "stroke": null },
  "encoding": {
    "x": { "field": "categoryName", "type": "nominal" },
    "y": { "field": "salesValue", "type": "quantitative" },
    "color": { "field": "categoryName", "type": "nominal" },
    "fillOpacity": {
      "condition": { "param": "databricks_mark_selection", "value": 1 },
      "value": 0.3
    },
    "stroke": {
      "condition": {
        "param": "databricks_mark_selection",
        "empty": false,
        "value": { "expr": "colors.markHighlightColor" }
      },
      "value": null
    },
    "strokeWidth": {
      "condition": { "param": "databricks_mark_selection", "empty": false, "value": 2 },
      "value": 0
    }
  }
}
グラフのサイズを自動調整する
グラフをコンテナに合わせてサイズ変更するには、仕様の最上位レベルに次の設定を追加してください。
"width": "container",
"height": "container",
"config": {
  "autosize": {
    "type": "fit",
    "contains": "padding"
  }
}
可視化の例
以下の例では、単純なレイヤーチャートからより高度な系統樹まで、カスタムビジュアライゼーションをステップバイステップで構築する方法を説明します。
移動平均を使用したレイヤードチャート
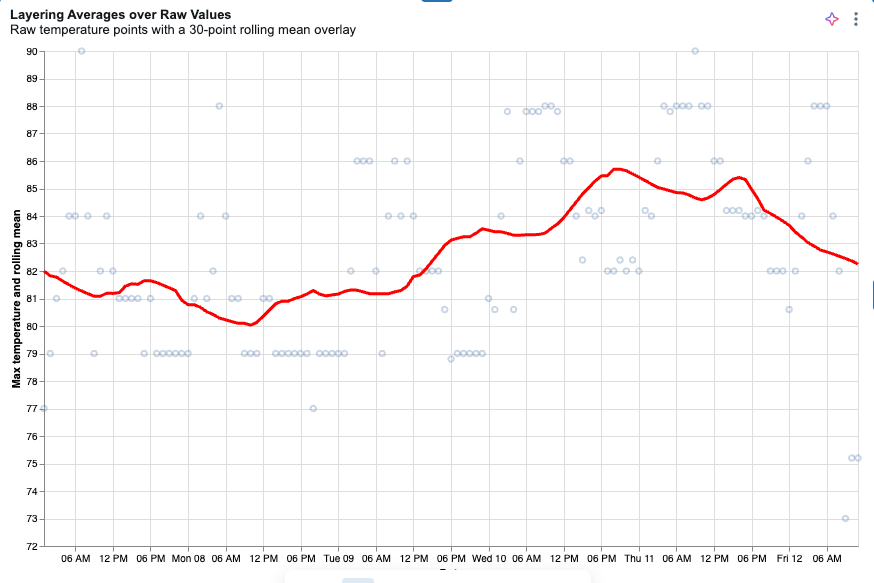
この例では、Databricks のサンプルデータセットの気象データを使用して、生温度データポイントに移動平均線を重ねてプロットするレイヤー化されたグラフを作成します。
-
以下のクエリーでデータセットを作成します。
SQLSELECT date, temperature AS temp_max
FROM samples.accuweather.historical_hourly_imperial
WHERE city_name = 'singapore'
ORDER BY date; -
視覚化構成ペインの 詳細設定 で、 カスタム可視化 を選択します。
-
前のステップで作成したデータセットを選択してください。
-
「 フィールド 」セクションで、日付列のフィールドを追加し、その「 名前 」を
dateに設定します。 -
温度列にフィールドを追加し、その 名前 を
temp_maxに設定します。 -
次の仕様を Vega-Lite仕様 エディターにコピーしてください。X軸が切り取られている場合は、グラフのサイズを自動調整するを参照してください。
JSON仕様
{
  "$schema": "https://vega.github.io/schema/vega-lite/v5.json",
  "width": "container",
  "height": "container",
  "config": {
    "autosize": { "type": "fit", "contains": "padding" }
  },
  "data": { "name": "databricks_query" },
  "transform": [
    {
      "window": [{ "field": "temp_max", "op": "mean", "as": "rolling_mean" }],
      "frame": [-15, 15]
    }
  ],
  "encoding": {
    "x": { "field": "date", "type": "temporal", "title": "Date" },
    "y": {
      "type": "quantitative",
      "scale": { "zero": false },
      "axis": { "title": "Max temperature and rolling mean" }
    }
  },
  "layer": [
    {
      "mark": { "type": "point", "opacity": 0.3 },
      "encoding": { "y": { "field": "temp_max", "title": "Max temperature" } }
    },
    {
      "mark": { "type": "line", "color": "red", "size": 3 },
      "encoding": { "y": { "field": "rolling_mean", "title": "Rolling mean of max temperature" } }
    }
  ]
}
系統樹
この例では、少量のサンプルデータを使用して、このページの上部に表示されている系統樹を作成します。Vega-Liteは指定された座標にポイントをプロットしますが、ネットワーク図自体のノード位置は計算しません。その計算は、データがチャートに到達する前のクエリー内で行われ、クエリーが各ポイントのx座標とy座標を事前計算します。クエリーは、仕様によって個別のレイヤーとしてレンダリングされる3つのレコードタイプを出力します。path行は曲線状のBranchを描画し、node行は葉の円を描画し、label行はグループラベルを配置します。
- downloadします。各行は化石の発見を表しており、
dig_longitudeとdig_latitudeがその発掘現場の座標を示しています。
-
サイドバーの
 ダッシュボード をクリックします。
 -
ダッシュボードの作成 をクリックします。
-
データ タブをクリックします。
-
[データを追加] をクリックし、 [upload] をクリックします。
-
ダウンロードしたファイルを [ファイルuploadからテーブルを作成または変更] ペインにドロップします。
-
テーブルを保存する カタログ と スキーマ を選択し、テーブル名を入力します。
-
[ テーブルを作成 ] をクリックします。完全なテーブルがデータセットとして自動的に追加されます。
-
SQLデータセットを追加 をクリックし、クエリーを貼り付けます。クエリーの
FROM句で、カタログ、スキーマ、およびテーブル名を、テーブル作成時に使用したものに置き換えます。 -
カスタムビジュアライゼーションの作成の手順に従って、カスタムビジュアライゼーションを作成します。 フィールド セクションで、各フィールド名を 名前 として使用し、次のフィールドを追加します:
record_type、x、y、fossil_tag、point_order、suborder、roar_score、clade_label、genus_symbol、family_taxon、およびlabel_text。仕様をVega-Lite JSONとして使用します。
SQLクエリー
WITH base AS (
  SELECT
    fossil_tag,
    genus_symbol,
    clade_label,
    suborder,
    family_taxon,
    dig_longitude,
    dig_latitude,
    roar_score
  FROM
    `my_catalog`.`default`.`dino_table`
),
root_pt AS (
  SELECT
    AVG(dig_longitude) AS rx,
    AVG(dig_latitude) AS ry
  FROM
    base
),
group_pts AS (
  SELECT
    suborder,
    AVG(dig_longitude) AS gx,
    AVG(dig_latitude) AS gy
  FROM
    base
  GROUP BY
    suborder
),
family_pts AS (
  SELECT
    suborder,
    family_taxon,
    AVG(dig_longitude) AS fx,
    AVG(dig_latitude) AS fy
  FROM
    base
  GROUP BY
    suborder,
    family_taxon
),
ctx AS (
  SELECT
    b.fossil_tag,
    b.suborder,
    b.family_taxon,
    b.clade_label,
    b.genus_symbol,
    b.dig_longitude,
    b.dig_latitude,
    b.roar_score,
    r.rx,
    r.ry,
    g.gx,
    g.gy,
    f.fx,
    f.fy
  FROM
    base b
      CROSS JOIN root_pt r
      JOIN group_pts g
        ON b.suborder = g.suborder
      JOIN family_pts f
        ON b.suborder = f.suborder
        AND b.family_taxon = f.family_taxon
),
waypoints AS (
  SELECT
    fossil_tag,
    suborder,
    family_taxon,
    clade_label,
    genus_symbol,
    roar_score,
    0 AS point_order,
    rx AS x,
    ry AS y
  FROM
    ctx
  UNION ALL
  SELECT
    fossil_tag,
    suborder,
    family_taxon,
    clade_label,
    genus_symbol,
    roar_score,
    1,
    rx + 0.30 * (gx - rx),
    ry + 0.30 * (gy - ry)
  FROM
    ctx
  UNION ALL
  SELECT
    fossil_tag,
    suborder,
    family_taxon,
    clade_label,
    genus_symbol,
    roar_score,
    2,
    gx + 0.15 * (fx - gx),
    gy + 0.15 * (fy - gy)
  FROM
    ctx
  UNION ALL
  SELECT
    fossil_tag,
    suborder,
    family_taxon,
    clade_label,
    genus_symbol,
    roar_score,
    3,
    gx + 0.50 * (fx - gx) + 0.03 * (dig_longitude - fx),
    gy + 0.50 * (fy - gy) + 0.03 * (dig_latitude - fy)
  FROM
    ctx
  UNION ALL
  SELECT
    fossil_tag,
    suborder,
    family_taxon,
    clade_label,
    genus_symbol,
    roar_score,
    4,
    fx + 0.15 * (dig_longitude - fx),
    fy + 0.15 * (dig_latitude - fy)
  FROM
    ctx
  UNION ALL
  SELECT
    fossil_tag,
    suborder,
    family_taxon,
    clade_label,
    genus_symbol,
    roar_score,
    5,
    fx + 0.65 * (dig_longitude - fx),
    fy + 0.65 * (dig_latitude - fy)
  FROM
    ctx
  UNION ALL
  SELECT
    fossil_tag,
    suborder,
    family_taxon,
    clade_label,
    genus_symbol,
    roar_score,
    6,
    dig_longitude,
    dig_latitude
  FROM
    ctx
)
SELECT
  fossil_tag,
  suborder,
  point_order,
  x,
  y,
  family_taxon,
  clade_label,
  genus_symbol,
  roar_score,
  'path' AS record_type,
  CAST(NULL AS STRING) AS label_text
FROM
  waypoints
UNION ALL
SELECT
  fossil_tag,
  suborder,
  99 AS point_order,
  dig_longitude AS x,
  dig_latitude AS y,
  family_taxon,
  clade_label,
  genus_symbol,
  roar_score,
  'node' AS record_type,
  CAST(NULL AS STRING) AS label_text
FROM
  base
UNION ALL
SELECT
  g.suborder AS fossil_tag,
  g.suborder AS suborder,
  100 AS point_order,
  g.gx
    + (g.gx - r.rx)
      * CASE LOWER(g.suborder)
        WHEN 'titanosauria' THEN 0.10
        WHEN 'hadrosauria' THEN 0.25
        WHEN 'ornithopoda' THEN 1.30
        WHEN 'stegosauria' THEN 0.73
        ELSE 0.55
      END AS x,
  g.gy
    + (g.gy - r.ry)
      * CASE LOWER(g.suborder)
        WHEN 'titanosauria' THEN 0.10
        WHEN 'hadrosauria' THEN 0.25
        WHEN 'ornithopoda' THEN 1.30
        WHEN 'stegosauria' THEN 0.73
        ELSE 0.55
      END AS y,
  CAST(NULL AS STRING) AS family_taxon,
  CAST(NULL AS STRING) AS clade_label,
  CAST(NULL AS STRING) AS genus_symbol,
  CAST(NULL AS DOUBLE) AS roar_score,
  'label' AS record_type,
  g.suborder AS label_text
FROM
  group_pts g CROSS JOIN root_pt r
JSON仕様
{
  "$schema": "https://vega.github.io/schema/vega-lite/v5.json",
  "data": { "name": "databricks_query" },
  "width": "container",
  "height": "container",
  "background": "white",
  "config": {
    "autosize": { "type": "fit", "contains": "padding" },
    "view": { "stroke": null }
  },
  "layer": [
    {
      "transform": [{ "filter": "datum.record_type === 'path'" }],
      "mark": {
        "type": "line",
        "interpolate": "basis",
        "strokeCap": "round",
        "strokeJoin": "round"
      },
      "encoding": {
        "x": {
          "field": "x",
          "type": "quantitative",
          "axis": null,
          "scale": { "zero": false, "nice": false }
        },
        "y": {
          "field": "y",
          "type": "quantitative",
          "axis": null,
          "scale": { "zero": false, "nice": false }
        },
        "detail": { "field": "fossil_tag", "type": "nominal" },
        "order": { "field": "point_order", "type": "quantitative" },
        "color": {
          "field": "suborder",
          "type": "nominal",
          "scale": { "scheme": "tableau10" },
          "legend": null
        },
        "opacity": { "value": 0.3 },
        "strokeWidth": { "value": 0.8 }
      }
    },
    {
      "transform": [{ "filter": "datum.record_type === 'node'" }],
      "mark": {
        "type": "circle",
        "opacity": 0.9,
        "stroke": "white",
        "strokeWidth": 0.3
      },
      "encoding": {
        "x": {
          "field": "x",
          "type": "quantitative",
          "axis": null,
          "scale": { "zero": false, "nice": false }
        },
        "y": {
          "field": "y",
          "type": "quantitative",
          "axis": null,
          "scale": { "zero": false, "nice": false }
        },
        "color": {
          "field": "suborder",
          "type": "nominal",
          "scale": { "scheme": "tableau10" },
          "legend": { "title": "Suborder", "orient": "right" }
        },
        "size": {
          "field": "roar_score",
          "type": "quantitative",
          "scale": { "domain": [0, 100], "range": [4, 150] },
          "legend": null
        },
        "tooltip": [
          { "field": "clade_label", "title": "Clade" },
          { "field": "genus_symbol", "title": "Symbol" },
          { "field": "suborder", "title": "Suborder" },
          { "field": "family_taxon", "title": "Family" },
          { "field": "roar_score", "title": "Roar Score", "format": ".1f" }
        ]
      }
    },
    {
      "transform": [{ "filter": "datum.record_type === 'label'" }],
      "mark": {
        "type": "text",
        "fontSize": 12,
        "fontWeight": "bold",
        "opacity": 0.85
      },
      "encoding": {
        "x": {
          "field": "x",
          "type": "quantitative",
          "axis": null,
          "scale": { "zero": false, "nice": false }
        },
        "y": {
          "field": "y",
          "type": "quantitative",
          "axis": null,
          "scale": { "zero": false, "nice": false }
        },
        "text": { "field": "label_text", "type": "nominal" },
        "color": {
          "field": "suborder",
          "type": "nominal",
          "scale": { "scheme": "tableau10" },
          "legend": null
        }
      }
    }
  ]
}
その他のチャート仕様
以下の仕様では、組み込みの視覚化の種類として利用できないチャートを示します。その他の例については、「Vega-Lite の例のギャラリー」を参照してください。
Bullet chart(バレットチャート)
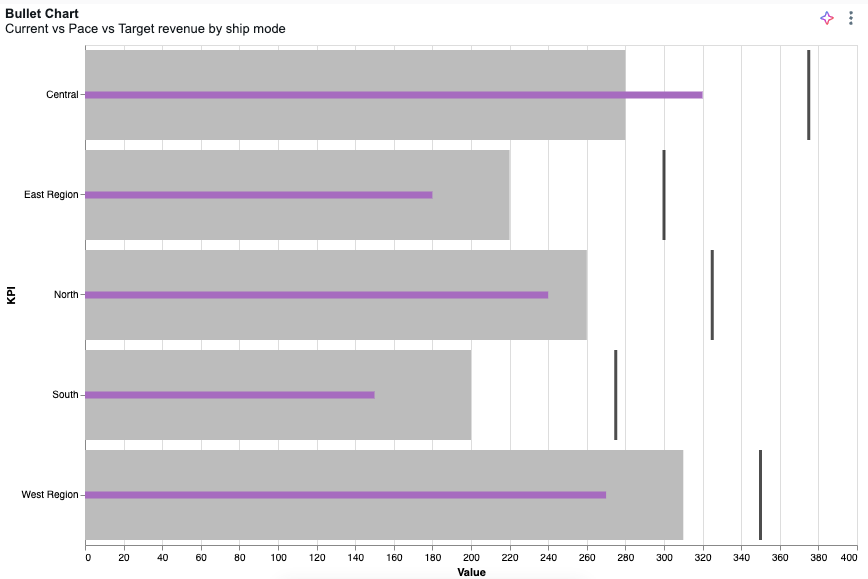
categoryField、currentField 、paceField 、targetField を Fields セクションで定義します。
JSON仕様
{
  "$schema": "https://vega.github.io/schema/vega-lite/v5.json",
  "width": "container",
  "height": "container",
  "data": { "name": "databricks_query" },
  "config": {
    "autosize": { "type": "fit", "contains": "padding" }
  },
  "transform": [
    {
      "fold": ["targetField", "paceField", "currentField"],
      "as": ["measure_name", "measure_value"]
    },
    {
      "calculate": "toNumber(datum.measure_value)",
      "as": "measure_value"
    },
    {
      "calculate": "{ \"targetField\": \"Target\", \"paceField\": \"Pace\", \"currentField\": \"Current\" }[datum.measure_name]",
      "as": "measure_label"
    },
    {
      "calculate": "indexof([\"Target\", \"Pace\", \"Current\"], datum.measure_label)",
      "as": "measure_order"
    }
  ],
  "layer": [
    {
      "mark": "bar",
      "params": [
        {
          "name": "legend_click",
          "select": { "type": "point", "fields": ["measure_label"] },
          "bind": "legend"
        }
      ],
      "encoding": {
        "color": { "field": "measure_label" },
        "opacity": { "value": 0 }
      }
    },
    {
      "transform": [{ "filter": { "param": "legend_click" } }],
      "layer": [
        {
          "layer": [
            {
              "mark": { "type": "bar", "tooltip": true },
              "encoding": { "color": { "field": "measure_label", "legend": null } },
              "transform": [{ "filter": { "field": "measure_label", "oneOf": ["Pace"] } }]
            },
            {
              "mark": { "type": "bar", "height": 7, "tooltip": true },
              "encoding": { "color": { "field": "measure_label", "legend": null } },
              "transform": [{ "filter": { "field": "measure_label", "oneOf": ["Current"] } }]
            },
            {
              "mark": { "type": "tick", "tooltip": true, "thickness": 3 },
              "encoding": { "color": { "field": "measure_label", "legend": null } },
              "transform": [{ "filter": { "field": "measure_label", "oneOf": ["Target"] } }]
            }
          ],
          "encoding": {
            "x": {
              "field": "measure_value",
              "type": "quantitative",
              "stack": null,
              "title": "Value",
              "axis": { "orient": "bottom" }
            },
            "color": {
              "scale": {
                "domain": ["Target", "Pace", "Current"],
                "range": ["#000000", "#bcbcbc", "#A66BBF"]
              }
            },
            "order": {
              "field": "measure_order",
              "type": "quantitative",
              "sort": "descending"
            }
          }
        }
      ],
      "encoding": {
        "y": {
          "field": "categoryField",
          "type": "ordinal",
          "title": "Category",
          "axis": { "labelOverlap": true }
        },
        "tooltip": [
          { "field": "categoryField", "type": "nominal", "title": "Category" },
          { "field": "currentField", "type": "quantitative", "title": "Current" },
          { "field": "paceField", "type": "quantitative", "title": "Pace" },
          { "field": "targetField", "type": "quantitative", "title": "Target" }
        ]
      }
    }
  ]
}
ゲージ
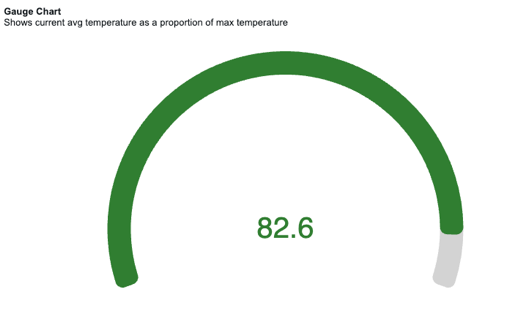
フィールド セクションで $valueField と $totalField を定義します。
JSON仕様
{
  "$schema": "https://vega.github.io/schema/vega-lite/v6.json",
  "width": "container",
  "height": "container",
  "data": { "name": "databricks_query" },
  "config": {
    "concat": { "spacing": 0 },
    "autosize": { "type": "fit", "contains": "padding" }
  },
  "params": [
    { "name": "ring_max", "expr": "min(width, height) / 2 - 16" },
    { "name": "ring_width", "expr": "max(12, (min(width, height) / 2) * 0.12)" },
    { "name": "ring_gap", "expr": "max(4, (min(width, height) / 2) * 0.03)" },
    { "name": "label_color", "value": "#000000" },
    { "name": "ring_background_opacity", "value": 0.3 },
    { "name": "ring0_percent", "value": 100 },
    { "name": "ring0_outer", "expr": "ring_max + 2" },
    { "name": "ring0_inner", "expr": "ring_max + 1" },
    { "name": "ring1_outer", "expr": "ring0_inner - ring_gap" },
    { "name": "ring1_inner", "expr": "ring1_outer - ring_width" },
    { "name": "ring1_middle", "expr": "(ring1_outer + ring1_inner) / 2" },
    { "name": "arc_size", "expr": "220" }
  ],
  "transform": [
    { "as": "ratio", "calculate": "datum['$valueField'] / datum['$totalField']" },
    { "as": "_arc_start_degrees", "calculate": "360 - ( arc_size / 2 )" },
    { "as": "_arc_end_degrees", "calculate": "0 + ( arc_size / 2 )" },
    { "as": "_arc_start_radians", "calculate": "2 * 3.14 * ( datum['_arc_start_degrees'] - 360 ) / 360" },
    { "as": "_arc_end_radians", "calculate": "2 * 3.14 * datum['_arc_end_degrees'] / 360" },
    { "as": "_arc_total_radians", "calculate": "datum['_arc_end_radians'] - datum['_arc_start_radians']" },
    { "as": "_ring_start_radians", "calculate": "datum['_arc_start_radians']" },
    {
      "as": "_ring_end_radians",
      "calculate": "datum['_arc_start_radians'] + ( datum['_arc_total_radians'] * datum['ratio'] )"
    }
  ],
  "layer": [
    {
      "mark": {
        "type": "arc",
        "color": "lightgrey",
        "theta": { "expr": "datum['_arc_start_radians']" },
        "radius": { "expr": "ring1_outer" },
        "theta2": { "expr": "datum['_arc_end_radians']" },
        "radius2": { "expr": "ring1_inner" },
        "cornerRadius": 10
      }
    },
    {
      "name": "RING",
      "mark": {
        "type": "arc",
        "theta": { "expr": "datum['_ring_start_radians']" },
        "radius": { "expr": "ring1_outer" },
        "theta2": { "expr": "datum['_ring_end_radians']" },
        "radius2": { "expr": "ring1_inner" },
        "cornerRadius": 10
      },
      "encoding": {
        "color": {
          "value": "#307E31",
          "condition": [
            { "test": "datum['ratio'] < 0.33", "value": "#880808" },
            { "test": "datum['ratio'] < 0.66", "value": "#E49B0F" }
          ]
        }
      }
    },
    {
      "mark": { "type": "text", "fontSize": 40 },
      "encoding": {
        "text": { "field": "$valueField" },
        "color": {
          "value": "#307E31",
          "condition": [
            { "test": "datum['ratio'] < 0.33", "value": "#880808" },
            { "test": "datum['ratio'] < 0.66", "value": "#E49B0F" }
          ]
        }
      }
    }
  ]
}
レーダーチャート
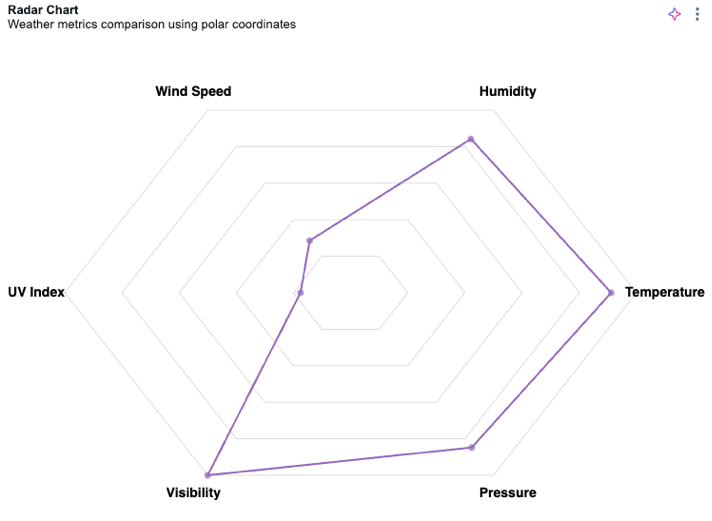
フィールド セクションで $key と $value を定義します。
JSON仕様
{
  "$schema": "https://vega.github.io/schema/vega-lite/v5.json",
  "width": "container",
  "height": "container",
  "config": {
    "autosize": { "type": "fit", "contains": "padding" }
  },
  "data": { "name": "databricks_query" },
  "transform": [
    { "window": [{ "op": "row_number", "as": "category" }] },
    { "calculate": "datum.category - 1", "as": "category" },
    {
      "joinaggregate": [
        { "op": "count", "as": "numCategories" },
        { "op": "max", "field": "$value", "as": "maxValue" }
      ]
    },
    { "calculate": "2 * PI * datum.category / datum.numCategories", "as": "angle" },
    { "calculate": "100 * datum['$value'] / datum.maxValue", "as": "r" },
    { "calculate": "datum.r * cos(datum.angle)", "as": "x" },
    { "calculate": "datum.r * sin(datum.angle)", "as": "y" },
    { "calculate": "110 * cos(datum.angle)", "as": "label_x" },
    { "calculate": "110 * sin(datum.angle)", "as": "label_y" }
  ],
  "layer": [
    {
      "transform": [
        { "joinaggregate": [{ "op": "count", "as": "numCategories" }] },
        { "aggregate": [{ "op": "max", "field": "numCategories", "as": "numCategories" }] },
        { "calculate": "[0,1,2,3,4,5,6,7,8,9,10,11,12,13,14,15,16,17,18,19,20]", "as": "cats" },
        { "flatten": ["cats"], "as": ["cat"] },
        { "filter": "datum.cat <= datum.numCategories" },
        { "calculate": "2 * PI * datum.cat / datum.numCategories", "as": "angle" },
        { "calculate": "100 * cos(datum.angle)", "as": "x" },
        { "calculate": "100 * sin(datum.angle)", "as": "y" }
      ],
      "mark": { "type": "line", "color": "#ddd", "strokeWidth": 1 },
      "encoding": {
        "x": { "field": "x", "type": "quantitative", "scale": { "domain": [-120, 120] }, "axis": null },
        "y": { "field": "y", "type": "quantitative", "scale": { "domain": [-120, 120] }, "axis": null },
        "order": { "field": "cat" }
      }
    },
    {
      "transform": [
        { "joinaggregate": [{ "op": "count", "as": "numCategories" }] },
        { "aggregate": [{ "op": "max", "field": "numCategories", "as": "numCategories" }] },
        { "calculate": "[20,40,60,80,100]", "as": "levels" },
        { "flatten": ["levels"], "as": ["level"] },
        { "calculate": "[0,1,2,3,4,5,6,7,8,9,10,11,12,13,14,15,16,17,18,19,20]", "as": "cats" },
        { "flatten": ["cats"], "as": ["cat"] },
        { "filter": "datum.cat <= datum.numCategories" },
        { "calculate": "2 * PI * datum.cat / datum.numCategories", "as": "angle" },
        { "calculate": "datum.level", "as": "r" },
        { "calculate": "datum.r * cos(datum.angle)", "as": "x" },
        { "calculate": "datum.r * sin(datum.angle)", "as": "y" }
      ],
      "mark": { "type": "line", "color": "#ddd", "strokeWidth": 1 },
      "encoding": {
        "x": { "field": "x", "type": "quantitative" },
        "y": { "field": "y", "type": "quantitative" },
        "detail": { "field": "level" },
        "order": { "field": "cat" }
      }
    },
    {
      "mark": { "type": "line", "color": "#9467bd", "strokeWidth": 2, "interpolate": "linear-closed" },
      "encoding": {
        "x": { "field": "x", "type": "quantitative" },
        "y": { "field": "y", "type": "quantitative" },
        "order": { "field": "category" }
      }
    },
    {
      "mark": { "type": "point", "filled": true, "size": 50, "color": "#9467bd" },
      "encoding": {
        "x": { "field": "x", "type": "quantitative" },
        "y": { "field": "y", "type": "quantitative" }
      }
    },
    {
      "mark": { "type": "text", "fontSize": 14, "fontWeight": "bold" },
      "encoding": {
        "x": { "field": "label_x", "type": "quantitative" },
        "y": { "field": "label_y", "type": "quantitative" },
        "text": { "field": "$key", "type": "nominal" }
      }
    }
  ],
  "view": { "stroke": null }
}
放射状チャート
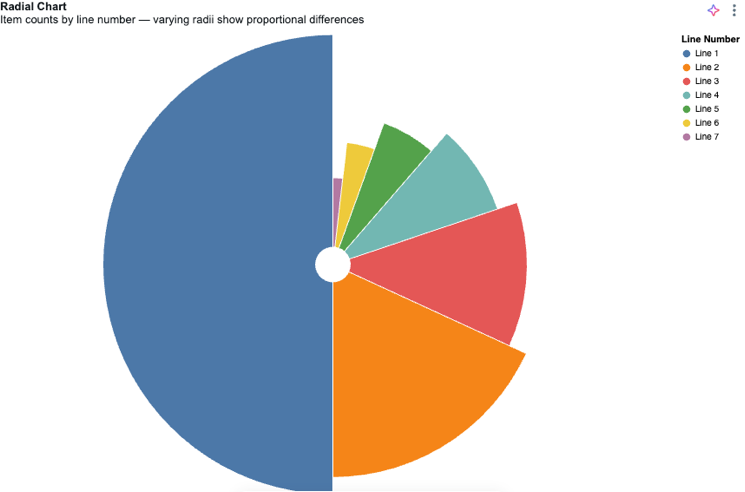
フィールド セクションで $valueField と $colorField を定義します。
JSON仕様
{
  "$schema": "https://vega.github.io/schema/vega-lite/v6.json",
  "width": "container",
  "height": "container",
  "config": {
    "autosize": { "type": "fit", "contains": "padding" }
  },
  "data": { "name": "databricks_query" },
  "transform": [
    {
      "aggregate": [{ "op": "sum", "field": "$valueField", "as": "total" }],
      "groupby": ["$colorField"]
    },
    {
      "window": [{ "op": "rank", "as": "rank" }],
      "sort": [{ "field": "total", "order": "descending" }]
    }
  ],
  "layer": [
    {
      "mark": { "type": "arc", "innerRadius": 20, "stroke": "#fff" }
    }
  ],
  "encoding": {
    "theta": {
      "field": "total",
      "type": "quantitative",
      "scale": { "type": "sqrt" },
      "stack": true,
      "sort": "descending"
    },
    "radius": { "field": "total", "scale": { "type": "sqrt", "zero": true } },
    "color": {
      "field": "$colorField",
      "type": "nominal",
      "title": "Sub-Category",
      "sort": { "field": "total", "order": "descending" },
      "legend": { "orient": "right" }
    },
    "tooltip": [
      { "field": "$colorField", "type": "nominal", "title": "Sub-Category" },
      { "field": "total", "type": "quantitative", "title": "Sales" }
    ]
  },
  "view": { "stroke": null }
}
サンバーストチャート
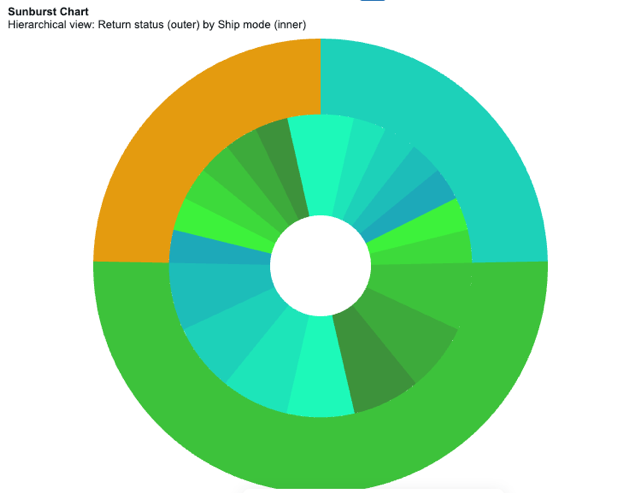
フィールド セクションでouterGroupField、innerGroupField、sizeFieldを定義します。
JSON仕様
{
  "$schema": "https://vega.github.io/schema/vega-lite/v5.json",
  "width": "container",
  "height": "container",
  "data": { "name": "databricks_query" },
  "config": {
    "autosize": { "type": "fit", "contains": "padding" }
  },
  "transform": [
    { "calculate": "datum['outerGroupField']", "as": "OUTSIDE" },
    { "calculate": "datum['innerGroupField']", "as": "INSIDE" },
    { "calculate": "datum.OUTSIDE + '-' + datum.INSIDE", "as": "OUT_IN" },
    { "calculate": "toNumber(datum['sizeField'])", "as": "SIZE" }
  ],
  "resolve": {
    "scale": { "color": "independent" },
    "legend": { "color": "independent" }
  },
  "layer": [
    {
      "mark": {
        "type": "arc",
        "tooltip": true,
        "innerRadius": { "expr": "min(width, height)/9" },
        "outerRadius": { "expr": "min(width, height)/3" }
      },
      "encoding": {
        "theta": { "field": "SIZE", "type": "quantitative", "stack": true },
        "color": {
          "field": "OUT_IN",
          "type": "ordinal",
          "sort": "ascending",
          "title": "Inner Grouping",
          "scale": {
            "range": [
              "#1DF9B9",
              "#1DE5B9",
              "#1DD1B9",
              "#1DBDB9",
              "#1DA9B9",
              "#3DF23B",
              "#3DDA3B",
              "#3DC23B",
              "#3DAA3B",
              "#3D923B"
            ]
          }
        },
        "order": { "field": "OUT_IN", "sort": "ascending" },
        "tooltip": [
          { "field": "OUTSIDE", "type": "nominal", "title": "Outer Grouping" },
          { "field": "INSIDE", "type": "nominal", "title": "Inner Grouping" },
          { "field": "SIZE", "type": "quantitative", "title": "Count" }
        ]
      }
    },
    {
      "transform": [
        {
          "aggregate": [{ "op": "sum", "field": "SIZE", "as": "total_users" }],
          "groupby": ["OUTSIDE"]
        }
      ],
      "mark": {
        "type": "arc",
        "tooltip": true,
        "innerRadius": { "expr": "min(width, height)/3" }
      },
      "encoding": {
        "theta": {
          "field": "total_users",
          "type": "quantitative",
          "stack": true,
          "sort": "ascending",
          "title": "Users Count"
        },
        "color": {
          "field": "OUTSIDE",
          "type": "ordinal",
          "sort": "ascending",
          "title": "Outer Grouping",
          "scale": { "range": ["#1DD1B9", "#3DC23B"] }
        },
        "order": { "field": "OUTSIDE", "sort": "ascending" },
        "tooltip": [
          { "field": "OUTSIDE", "type": "nominal", "title": "Outer Grouping" },
          { "field": "total_users", "type": "quantitative", "title": "Count" }
        ]
      }
    }
  ]
}
制限事項:
- ツリーマップチャートはサポートされていません。ベガライトはツリーマップをサポートしていません。
- 画像マークは、PNG、JPEG、またはWebP形式の、37 KB以下のインラインBase64
data:画像URL(例:data:image/png;base64,...)のみをサポートしています。リモート画像URL(https:またはhttp:)、相対URL、SVG画像、フィールドまたは式によって駆動される画像URLはサポートされていません。