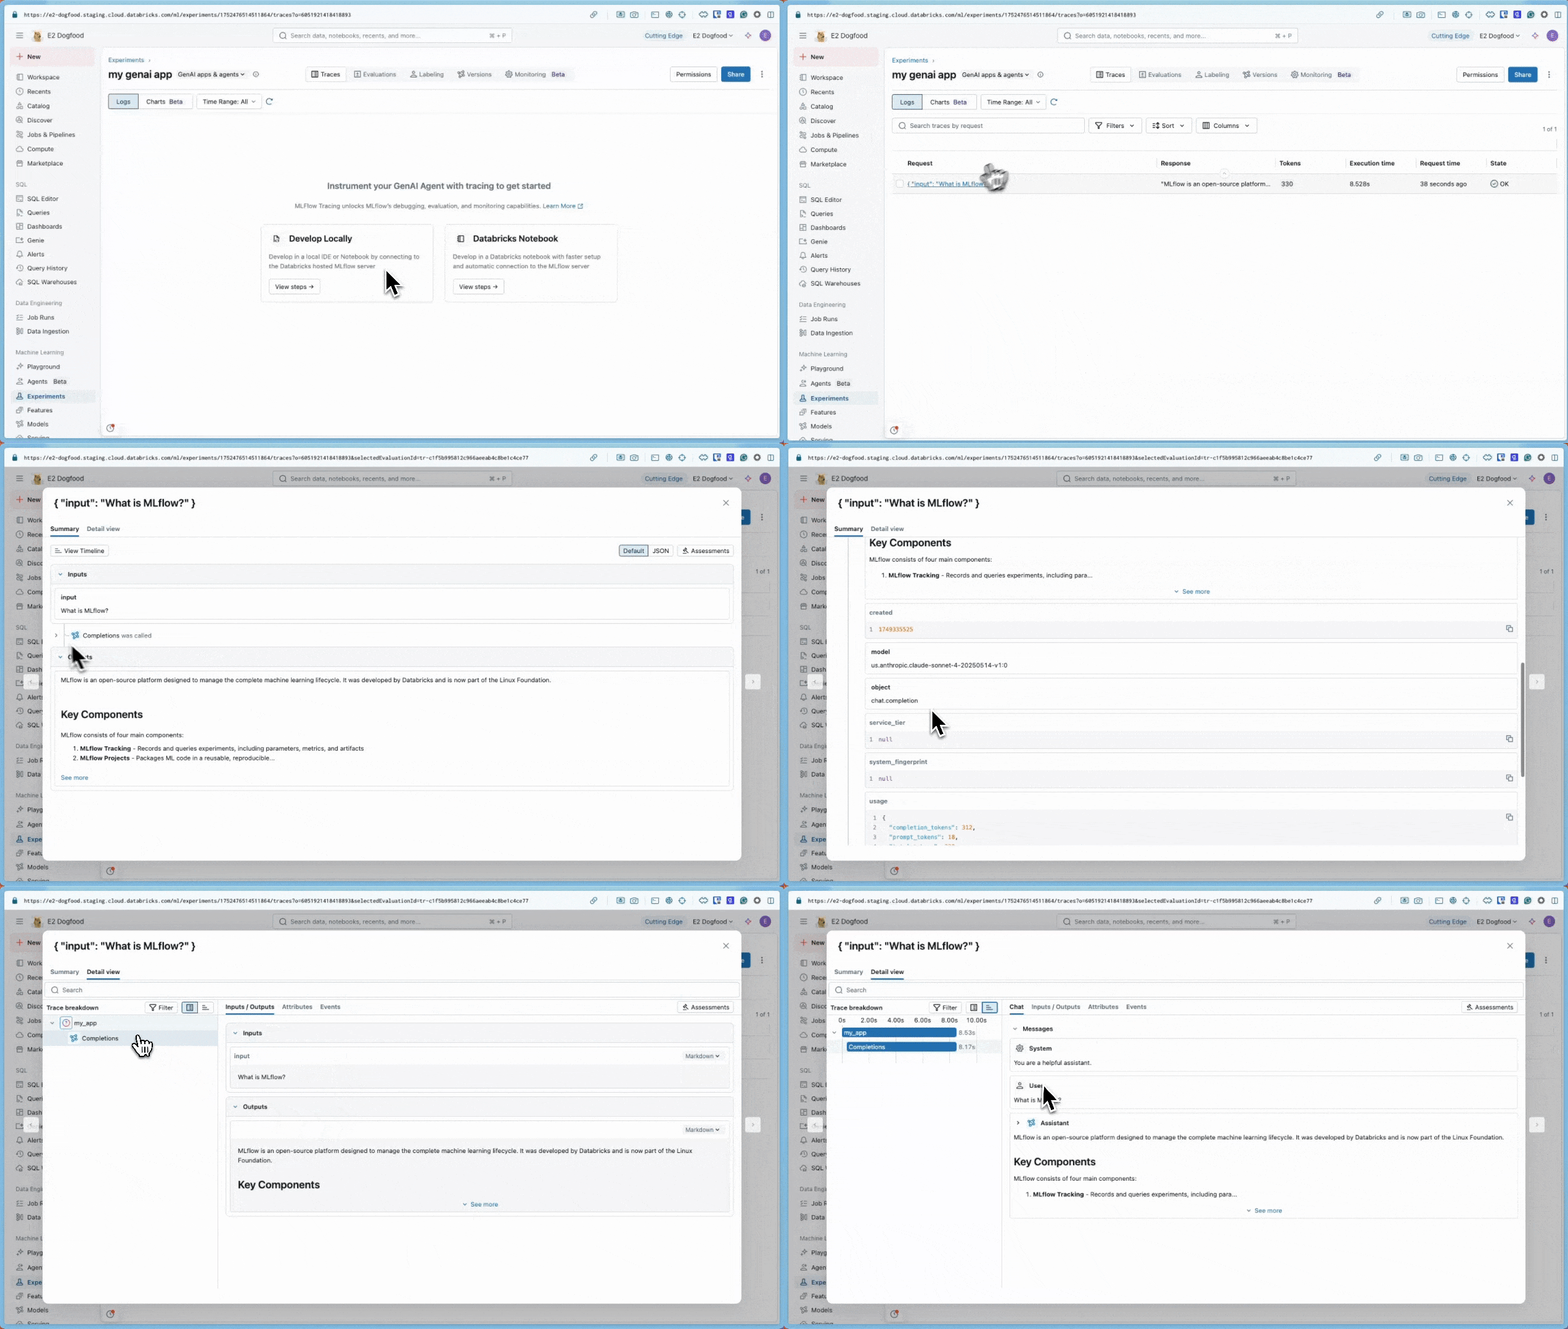
Get started: Tracing a GenAI app
MLflow Tracing captures your GenAI app's execution flow, providing visibility into every step from user input to final output. See exactly what happens inside your application - including prompts, model calls, tool usage, latencies, and token counts.
In this quickstart, you will instrument a simple GenAI app to automatically capture detailed traces for debugging and optimization. Pick one of these two guides based on your development environment:
Choose the quickstart guide based on your preferred development environment:
- Databricks Notebook - Use a hosted notebook in your Databricks workspace
- Locally in an IDE or notebook - Use any local development environment such as an IDE (VS Code, PyCharm, Cursor or others) or a locally-hosted notebook environment (Jupyter or others)

Guides and references
For details on concepts and features in this guide, see:
- MLflow Tracing guide - Start here for more in-depth learning about MLflow Tracing
- MLflow Tracing integrations - 20+ libraries with automatic tracing integrations
- Tracing concepts - Understand the fundamentals of MLflow Tracing