Tracing deployment
MLflow Tracing provides comprehensive observability for production GenAI apps by capturing execution details that you can view in the MLflow UI or analyze as tables. This page provides a feature reference detailing:
- Deployment options: You can deploy an AI agent on Databricks or outside of Databricks. This choice determines your options for trace logging.
- Trace logging options: Traces can be logged to an MLflow experiment or to Delta tables.
For guides and tutorials, see Deploy agents with tracing.
This page is for MLflow 3. For MLflow 2 Tracing, see the open-source documentation for your MLflow version.
Deployment options for tracing
Databricks supports deployment inside and outside of Databricks. This choice affects your options for trace logging: MLflow experiment logging, production monitoring tables, and inference tables.
Deployment location | Deployment method | |||
|---|---|---|---|---|
Databricks | Supported | Supported | Supported | |
Outside Databricks | Supported | Supported | Not supported |
Trace logging options
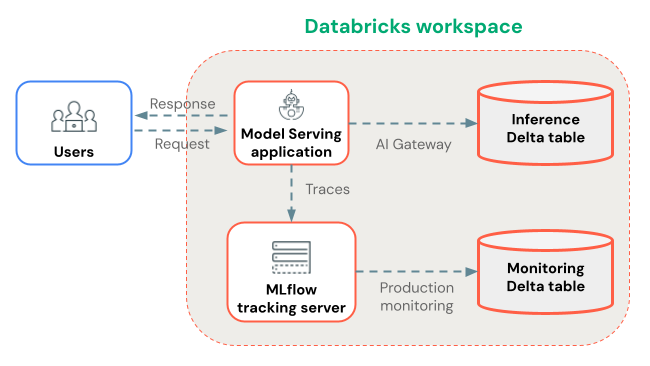
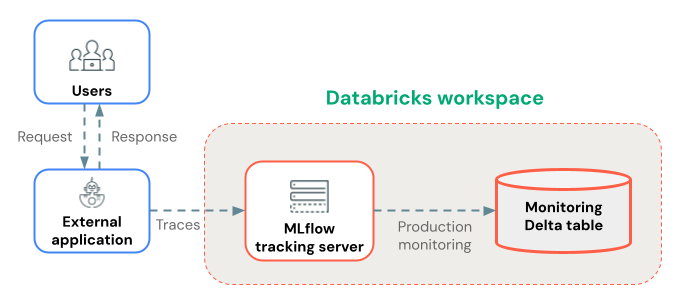
Traces can be logged to the Databricks MLflow Tracking service or to Delta tables. The example architectures below illustrate the data flow for all logging options.
- Deploy on Databricks
- Deploy outside of Databricks
Trace logging option | Access and governance | Benefits | Limitations |
|---|---|---|---|
Traces can be viewed in the MLflow experiment UI or queried programmatically. Access is governed by MLflow experiment ACLs. | Real-time logging. Supports very large traces. | 100K traces per experiment. Max 60 queries per second (QPS). Ask your Databricks account team for help to raise these limits. | |
Delta tables are governed using Unity Catalog privileges. | Supports very large traces. | Same as MLflow experiment logging. ~15 minute delay. | |
Delta tables are governed using Unity Catalog privileges. | No limit on traces per experiment. | 30-90 minute delay. Limits on trace size. |
In the table above, if the MLflow Experiment is created with a custom storage location for artifacts, then the experiment's trace data will be stored in your specified location. Specifically, if you create a workspace experiment, you can set a non-default storage location for artifacts and trace data by specifying an artifact_location such as a Unity Catalog volume. In this case, trace data access is governed by the location's permissions, such as Unity Catalog volume privileges.
Guides and tutorials
Feature references
For details on concepts and features in this guide, see:
- Production monitoring concepts - Understand how MLflow enables continuous quality monitoring
- Tracing data model - Learn about traces, spans, and attributes
- Logging assessments - Understand how feedback is stored and used