Build dashboards with MLflow metadata in system tables
This feature is in Public Preview.
Using MLflow metadata in system tables, you can build dashboards to analyze your MLflow experiments and runs from the entire workspace. Using the existing MLflow UI and REST APIs for these tasks would require extensive, time-consuming iteration.
Dashboard for single run details
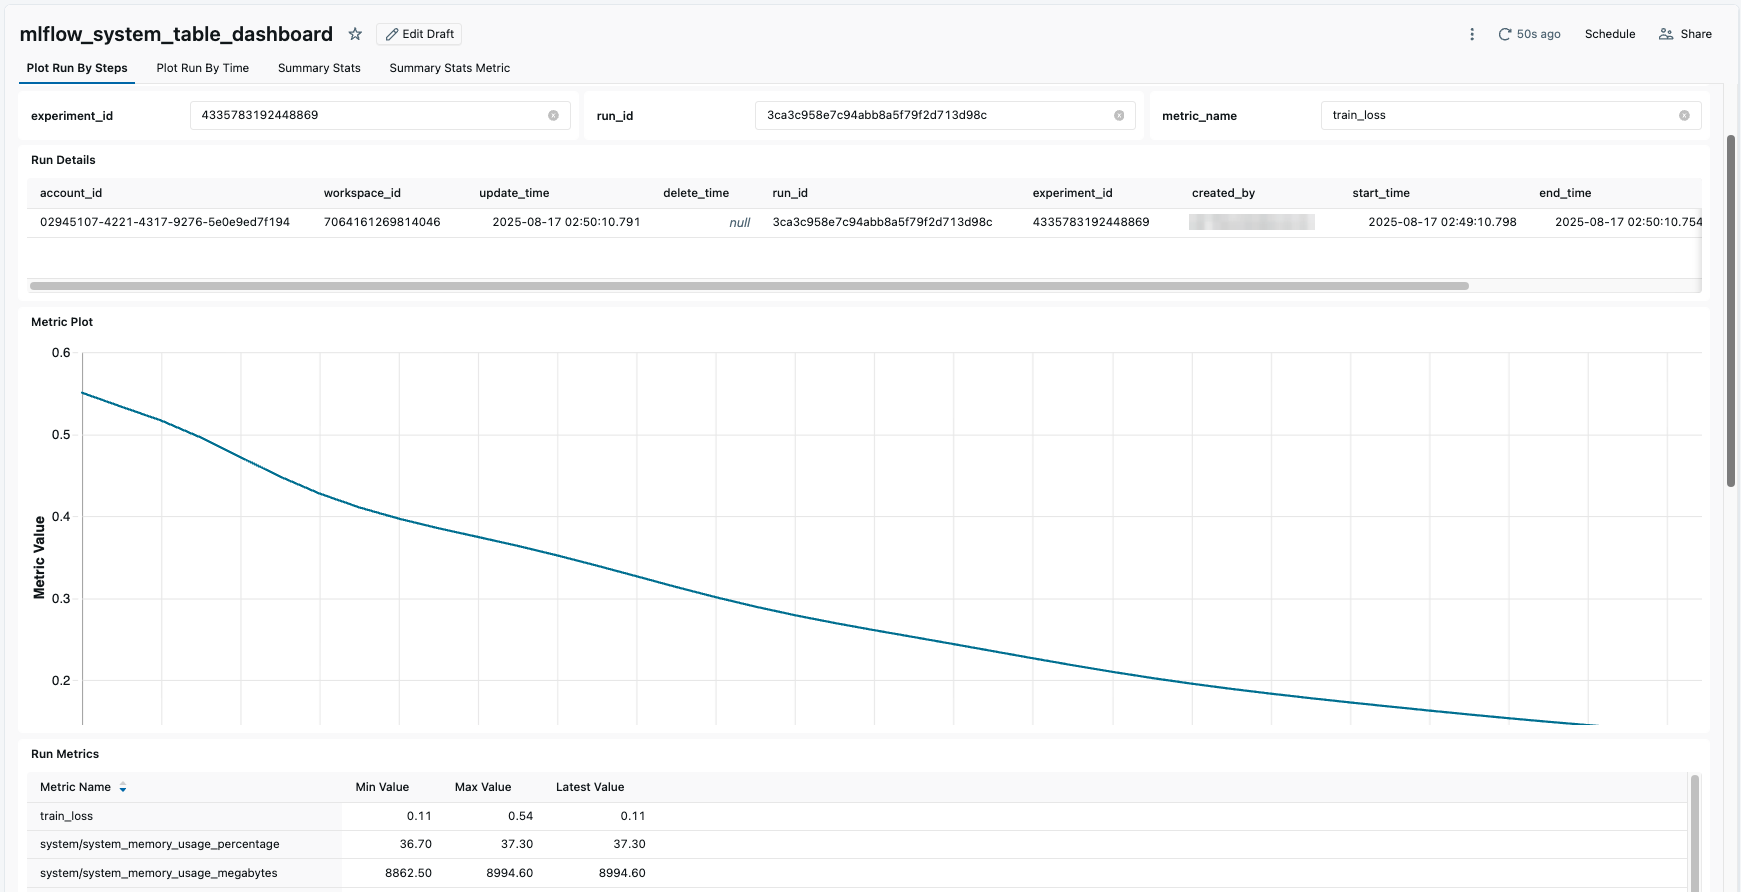
To start visualizing your MLflow data, download this example dashboard as a JSON file and import it into your workspace. This dashboard contains a skeleton of data to replicate what is shown on the run details page in the MLflow UI.
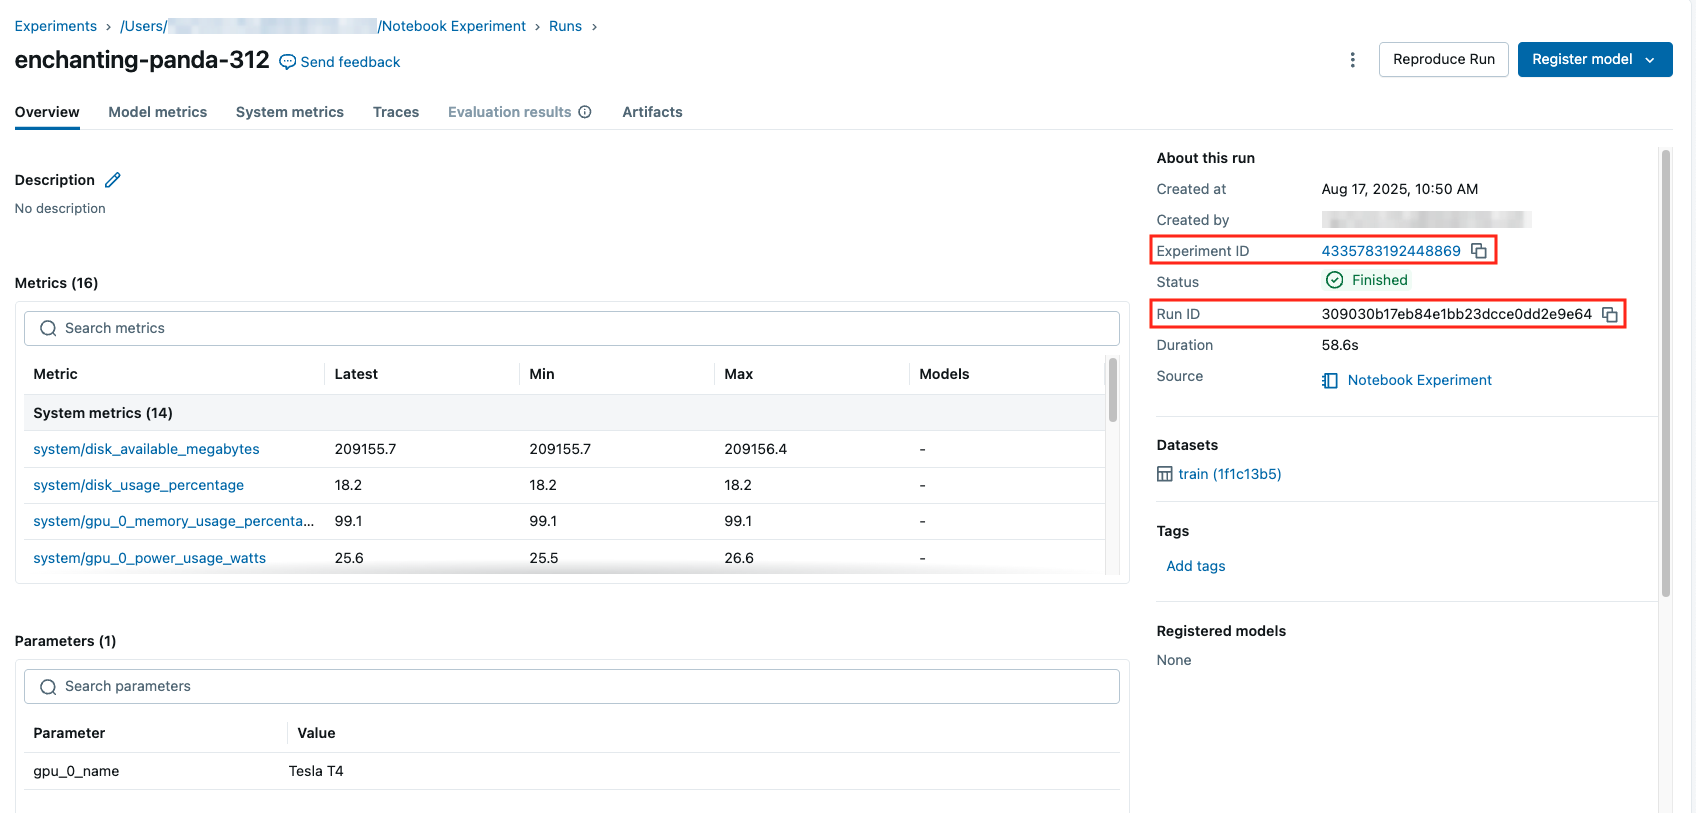
For a given experiment ID, run ID, and metric name, it displays run details along with tags, parameters, and a metric graph. You can obtain the experiment ID and run ID from the run details page, both from the UI and in the URL itself: https://<workspace>.databricks.com/ml/experiments/<experiment_id>/runs/<run_id>.
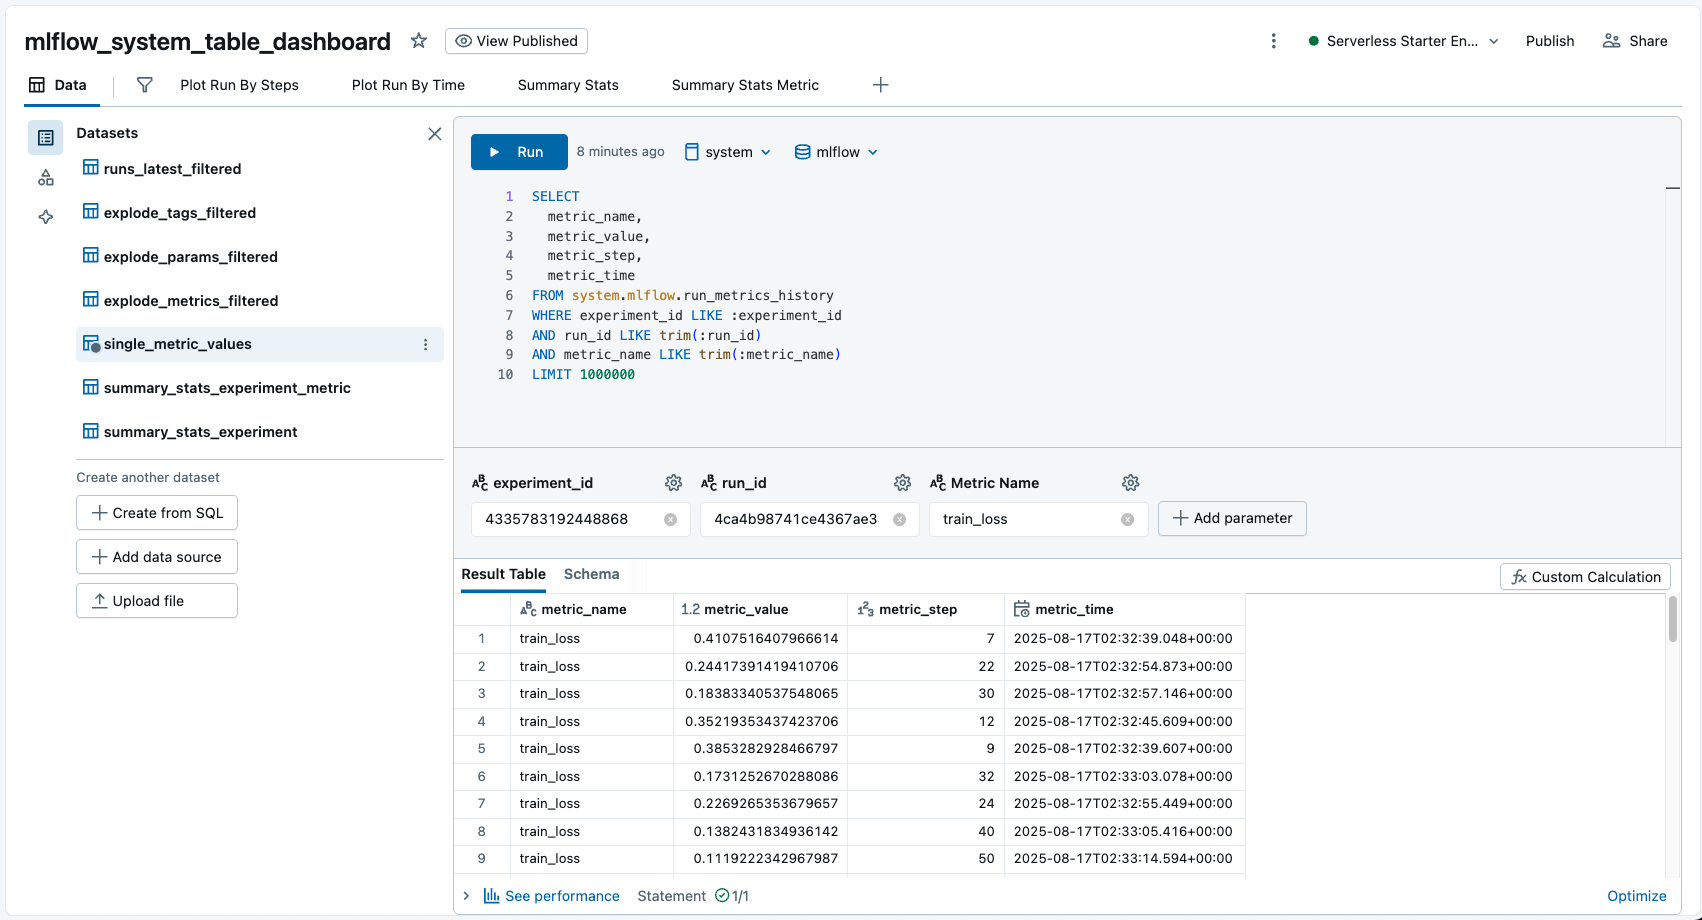
If you navigate to the dashboard panel from the left navigation menu, you can import the dashboard from a JSON file definition here. From there, you can use the input boxes on the top to filter for the relevant run and experiment within your workspace to plot. Feel free to explore the queries and change the plots to meet your needs.
Dashboard to monitor average GPU utilization across experiments
On the fourth tab from the above dashboard, you can input a metric name to get summary statistics across all experiments with that metric within a given time window. This information can be useful for monitoring system metrics recorded by MLflow across your workspace to monitor for inefficient CPU, memory, or GPU utilization.
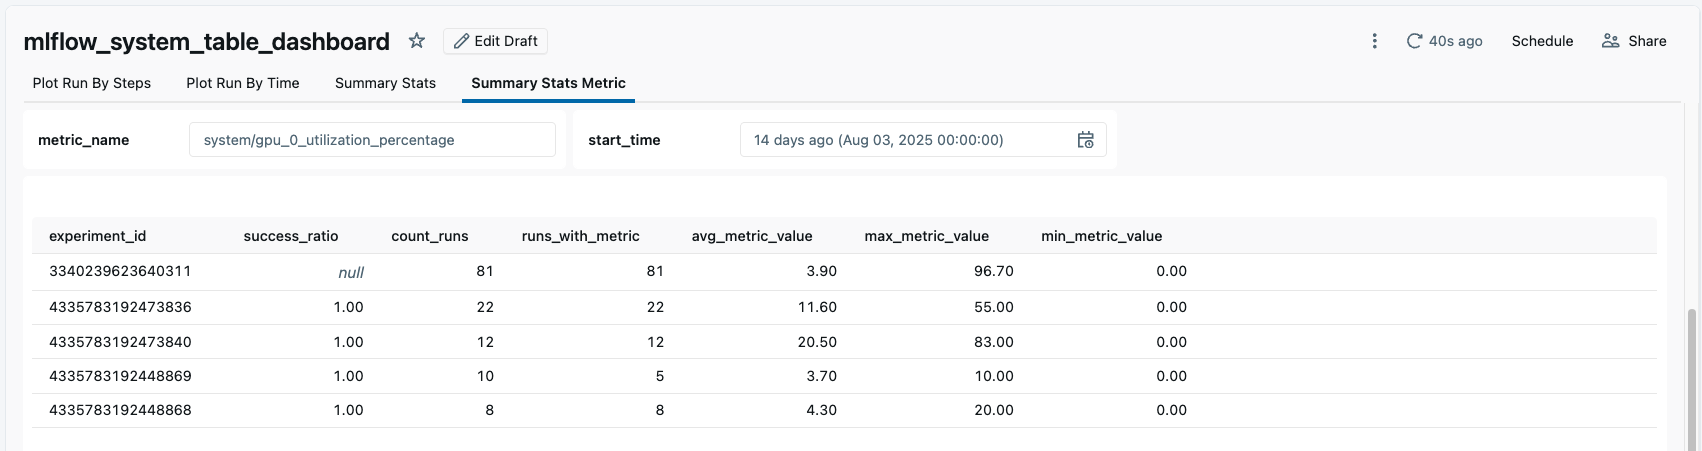
In the example, we can see several experiments with an average GPU utilization of less than 10% which we may want to investigate.