Organize training runs with MLflow experiments
Experiments are units of organization for your MLflow runs, including agent traces, LLM application evaluations, and model training runs. There are two types of experiments: workspace and notebook.
- You can create a workspace experiment from the Databricks Mosaic AI UI or the MLflow API. Workspace experiments are not associated with any notebook, and any notebook can log a run to these experiments by using the experiment ID or the experiment name.
- A notebook experiment is associated with a specific notebook. Databricks automatically creates a notebook experiment if there is no active experiment when you start a run using mlflow.start_run().
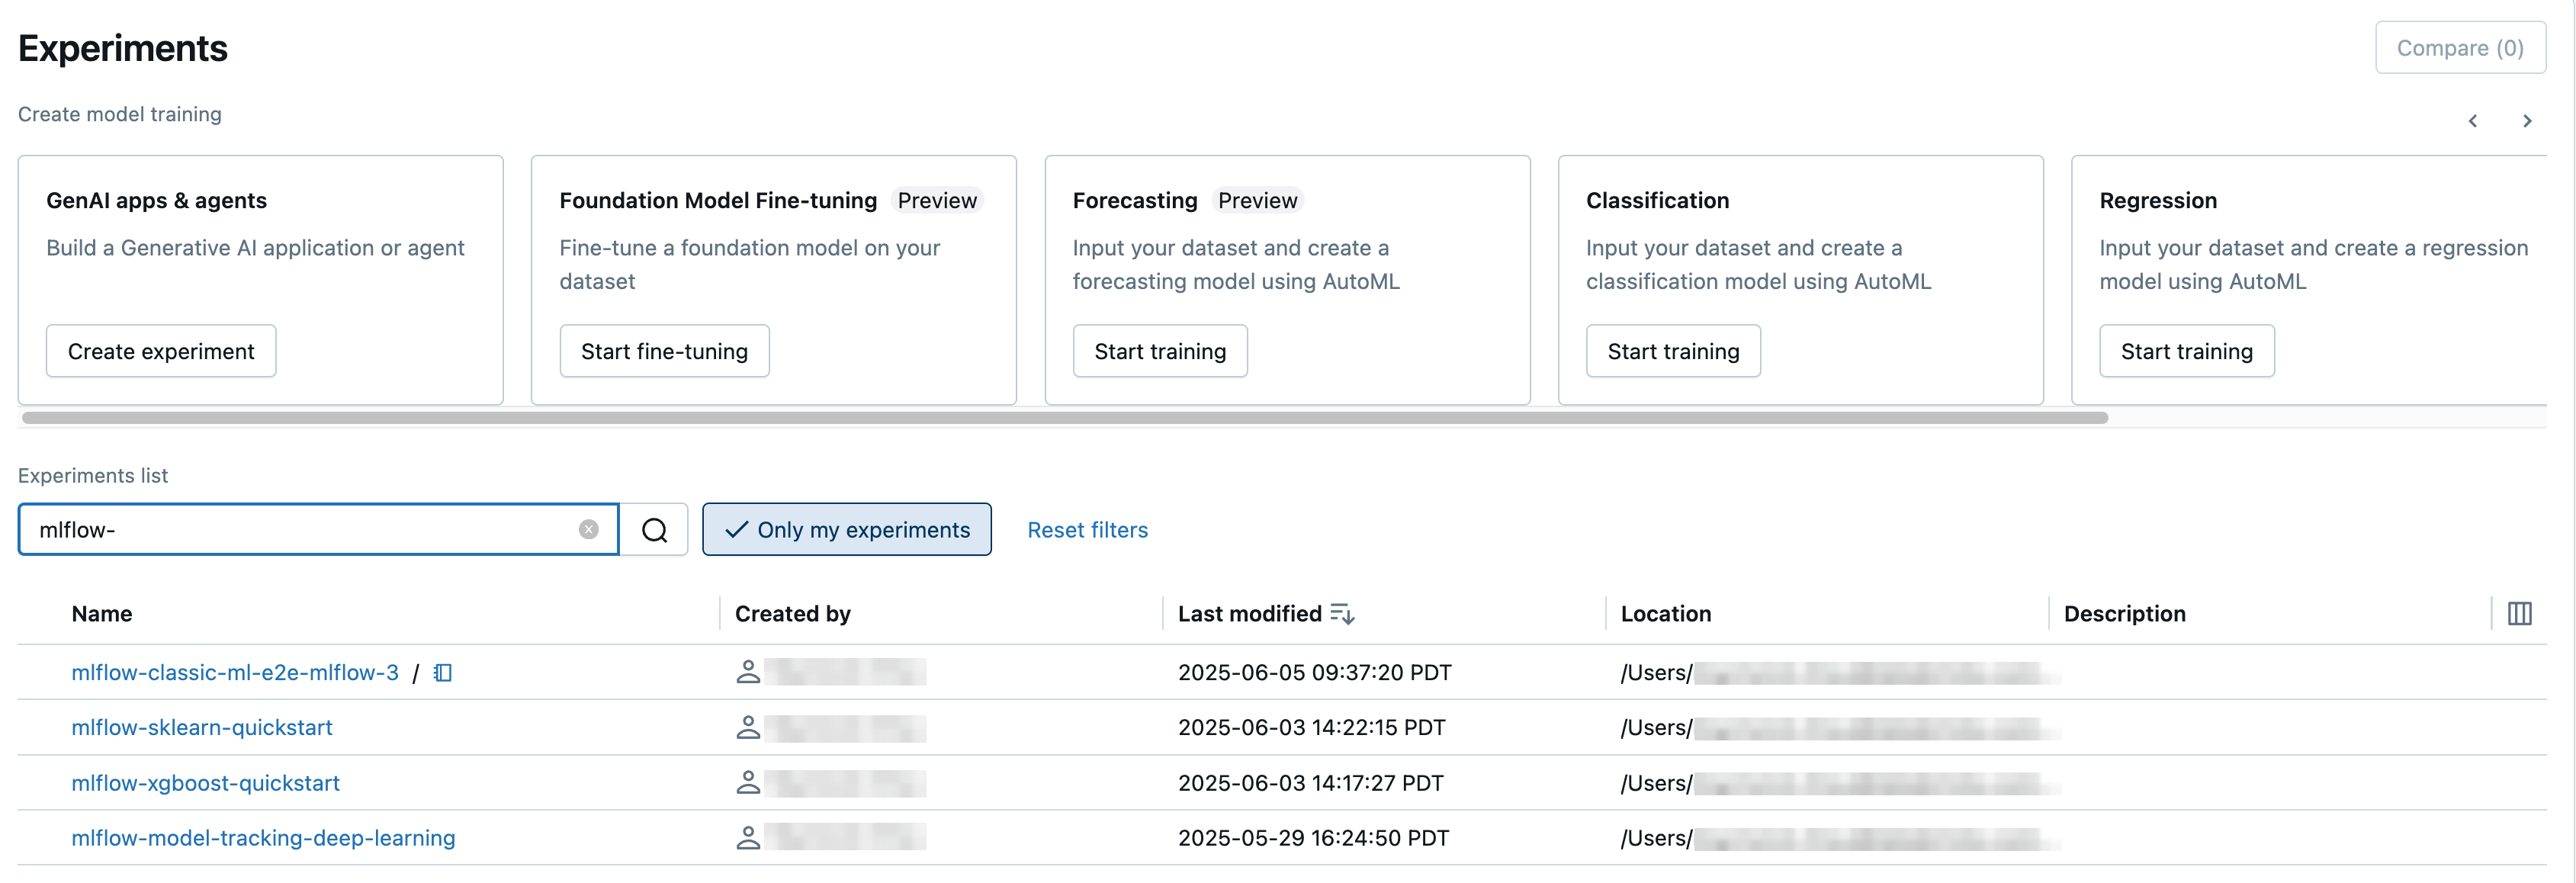
To see all of the experiments in a workspace that you have access to, select Machine Learning > Experiments in the sidebar.
Create workspace experiment
This section describes how to create a workspace experiment using the Databricks UI. You can create a workspace experiment directly from the workspace or from the Experiments page.
You can also use the MLflow API, or the Databricks Terraform provider with databricks_mlflow_experiment.
For instructions on logging runs to workspace experiments, see Log runs and models to an experiment.
For GDPR compliance, stale experiments are purged from workspaces. For workspaces where customer-managed keys are used, the stale experiments are only purged when the customer-managed key is accessible by Databricks. See Configure customer-managed keys for encryption to give access.
Create experiment from the workspace
-
Click
Workspace in the sidebar.
-
Navigate to the folder in which you want to create the experiment.
-
Right-click on the folder and select Create > MLflow experiment.
-
In the Create MLflow Experiment dialog, enter a name for the experiment and an optional artifact location. If you do not specify an artifact location, artifacts are stored in MLflow-managed artifact storage:
dbfs:/databricks/mlflow-tracking/<experiment-id>.For workspaces enabled for Unity Catalog, you can also store artifacts in a Unity Catalog volume. To store artifacts in your own cloud storage, create a Unity Catalog external volume.
To store artifacts in a Unity Catalog volume, specify a volume path of the form
dbfs:/Volumes/catalog_name/schema_name/volume_name/user/specified/pathas your MLflow experiment artifact location, either in the UI or as shown in the following code:Pythonimport mlflow # Storing artifacts in a volume requires MLflow 2.15.0 or above
EXP_NAME = "/Users/first.last@databricks.com/my_experiment_name"
CATALOG = "my_catalog"
SCHEMA = "my_schema"
VOLUME = "my_volume"
ARTIFACT_PATH = f"dbfs:/Volumes/{CATALOG}/{SCHEMA}/{VOLUME}" # can be a managed or external volume
mlflow.set_tracking_uri("databricks")
mlflow.set_registry_uri("databricks-uc")
if mlflow.get_experiment_by_name(EXP_NAME) is None:
mlflow.create_experiment(name=EXP_NAME, artifact_location=ARTIFACT_PATH)
mlflow.set_experiment(EXP_NAME)If your workspace is not enabled for Unity Catalog, or you do not have access to MLflow 2.15.0 or above, specify a path in this format:
dbfs:/path/to/artifacts.Databricks recommends using a Unity Catalog volume for artifact storage. If neither a Unity Catalog volume nor DBFS is a suitable option, you can also store artifacts directly to S3 (not recommended). To store artifacts in S3, specify a URI of the form
s3://<bucket>/<path>. MLflow obtains credentials to access S3 from your cluster's instance profile. Artifacts stored in S3 do not appear in the MLflow UI; you must download them using an object storage client.The upload and download file size limits are both 5GB.
noteWhen you store an artifact in a location other than MLflow-managed DBFS (default) or Unity Catalog volumes, the artifact does not appear in the MLflow UI. Models stored in locations other than these cannot be registered in Model Registry.
-
Click Create. The experiment details page for the new experiment appears.
-
To log runs to this experiment, call
mlflow.set_experiment()with the experiment path. To display the experiment path, click the information iconto the right of the experiment name. See Log runs and models to an experiment for details and an example notebook.
Create experiment from the Experiments page
To create a foundation model fine-tuning, AutoML, or custom experiment, click Experiments or select New > Experiment in the left sidebar.
At the top of the page, select one of the following options to configure an experiment:
- Foundation Model Fine-tuning. The Foundation Model Fine-tuning dialog appears. For details, see Create a training run using the Foundation Model Fine-tuning UI.
- Forecasting. The Configure Forecasting experiment dialog appears. For details, see Configure the AutoML experiment.
- Classification. The Configure Classification experiment dialog appears. For details, see Set up classification experiment with the UI.
- Regression. The Configure Classification experiment dialog appears. For details, see Set up regression experiment with the UI.
- Custom. The Create MLflow Experiment dialog appears. For details, see Step 4 in Create experiment from the workspace.
Create notebook experiment
When you use the mlflow.start_run() command in a notebook, the run logs metrics and parameters to the active experiment. If no experiment is active, Databricks creates a notebook experiment. A notebook experiment shares the same name and ID as its corresponding notebook. The notebook ID is the numerical identifier at the end of a Notebook URL and ID.
Users running MLflow on compute with dedicated group access must verify the group has permission to write to the directory where the notebook lives, or use mlflow.set_tracking_uri("<path>") to specify a folder for MLflow to write to.
Alternatively, you can pass a Databricks workspace path to an existing notebook in mlflow.set_experiment() to create a notebook experiment for it.
For instructions on logging runs to notebook experiments, see Log runs and models to an experiment.
If you delete a notebook experiment using the API (for example, MlflowClient.tracking.delete_experiment() in Python), the notebook itself is moved into the Trash folder.
View experiments
Each experiment that you have access to appears on the experiments page. From this page, you can view any experiment. Click on an experiment name to display the experiment details page.
Additional ways to access the experiment details page:
- You can access the experiment details page for a workspace experiment from the workspace menu.
- You can access the experiment details page for a notebook experiment from the notebook.
To search for experiments, type text in the Filter experiments field and press Enter or click the magnifying glass icon. The experiment list changes to show only those experiments that contain the search text in the Name or Location columns.
For advanced usage, you can enter a search query for tags.`mlflow.note.content` to search based on the Description column. For further details on syntax, see Search Experiments. Please note that unlike searching for Name or Location, searching through tags requires you to manually construct the search query with an identifier and comparator. It will not directly return all results that contain the search text.
Click the name of any experiment in the table to display its experiment details page:

The experiment details page lists all runs associated with the experiment. From the table, you can open the run page for any run associated with the experiment by clicking its Run Name. The Source column gives you access to the notebook version that created the run. You can also search and filter runs by metrics or parameter settings.
View workspace experiment
- Click
Workspace in the sidebar.
- Go to the folder containing the experiment.
- Click the experiment name.
View notebook experiment
In the notebook's right sidebar, click the Experiment icon .
The Experiment Runs sidebar appears and shows a summary of each run associated with the notebook experiment, including run parameters and metrics. At the top of the sidebar is the name of the experiment that the notebook most recently logged runs to (either a notebook experiment or a workspace experiment).
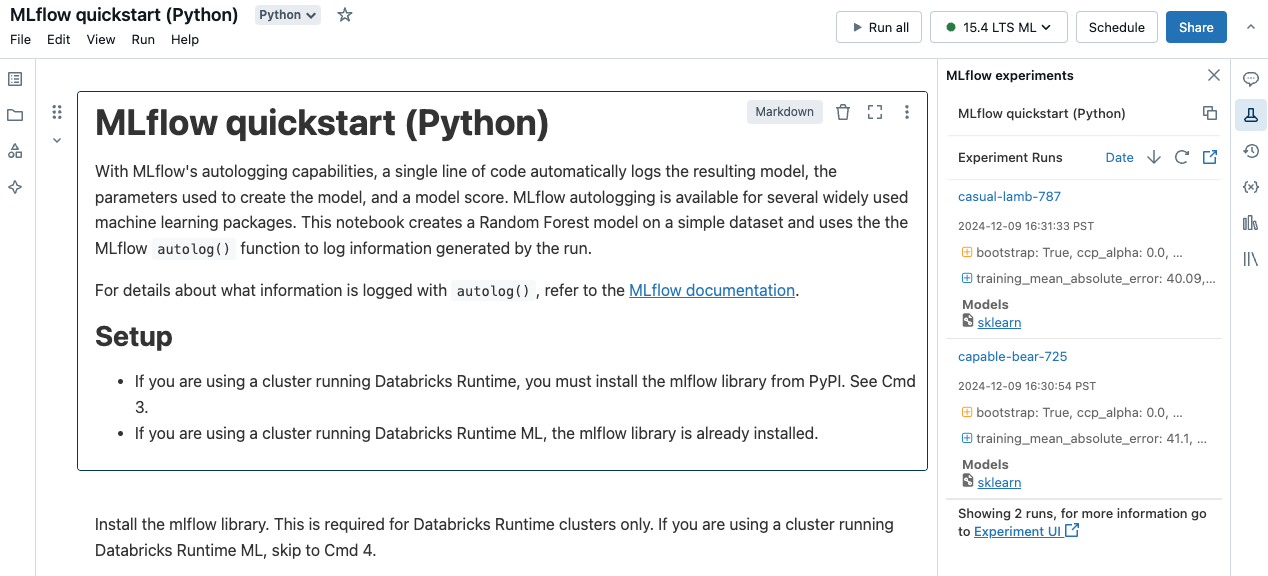
From the sidebar, you can navigate to the experiment details page or directly to a run.
- To view the experiment, click
at the far right, next to Experiment Runs.
- To display a run, click the name of the run.
Manage experiments
You can rename, delete, or manage permissions for an experiment you own from the experiments page, the experiment details page, or the workspace menu.
You cannot directly rename, delete, or manage permissions on an MLflow experiment that was created by a notebook in a Databricks Git folder. You must perform these actions at the Git folder level.
Rename experiment
You can rename an experiment that you own from the Experiments page or from the experiment details page for that experiment.
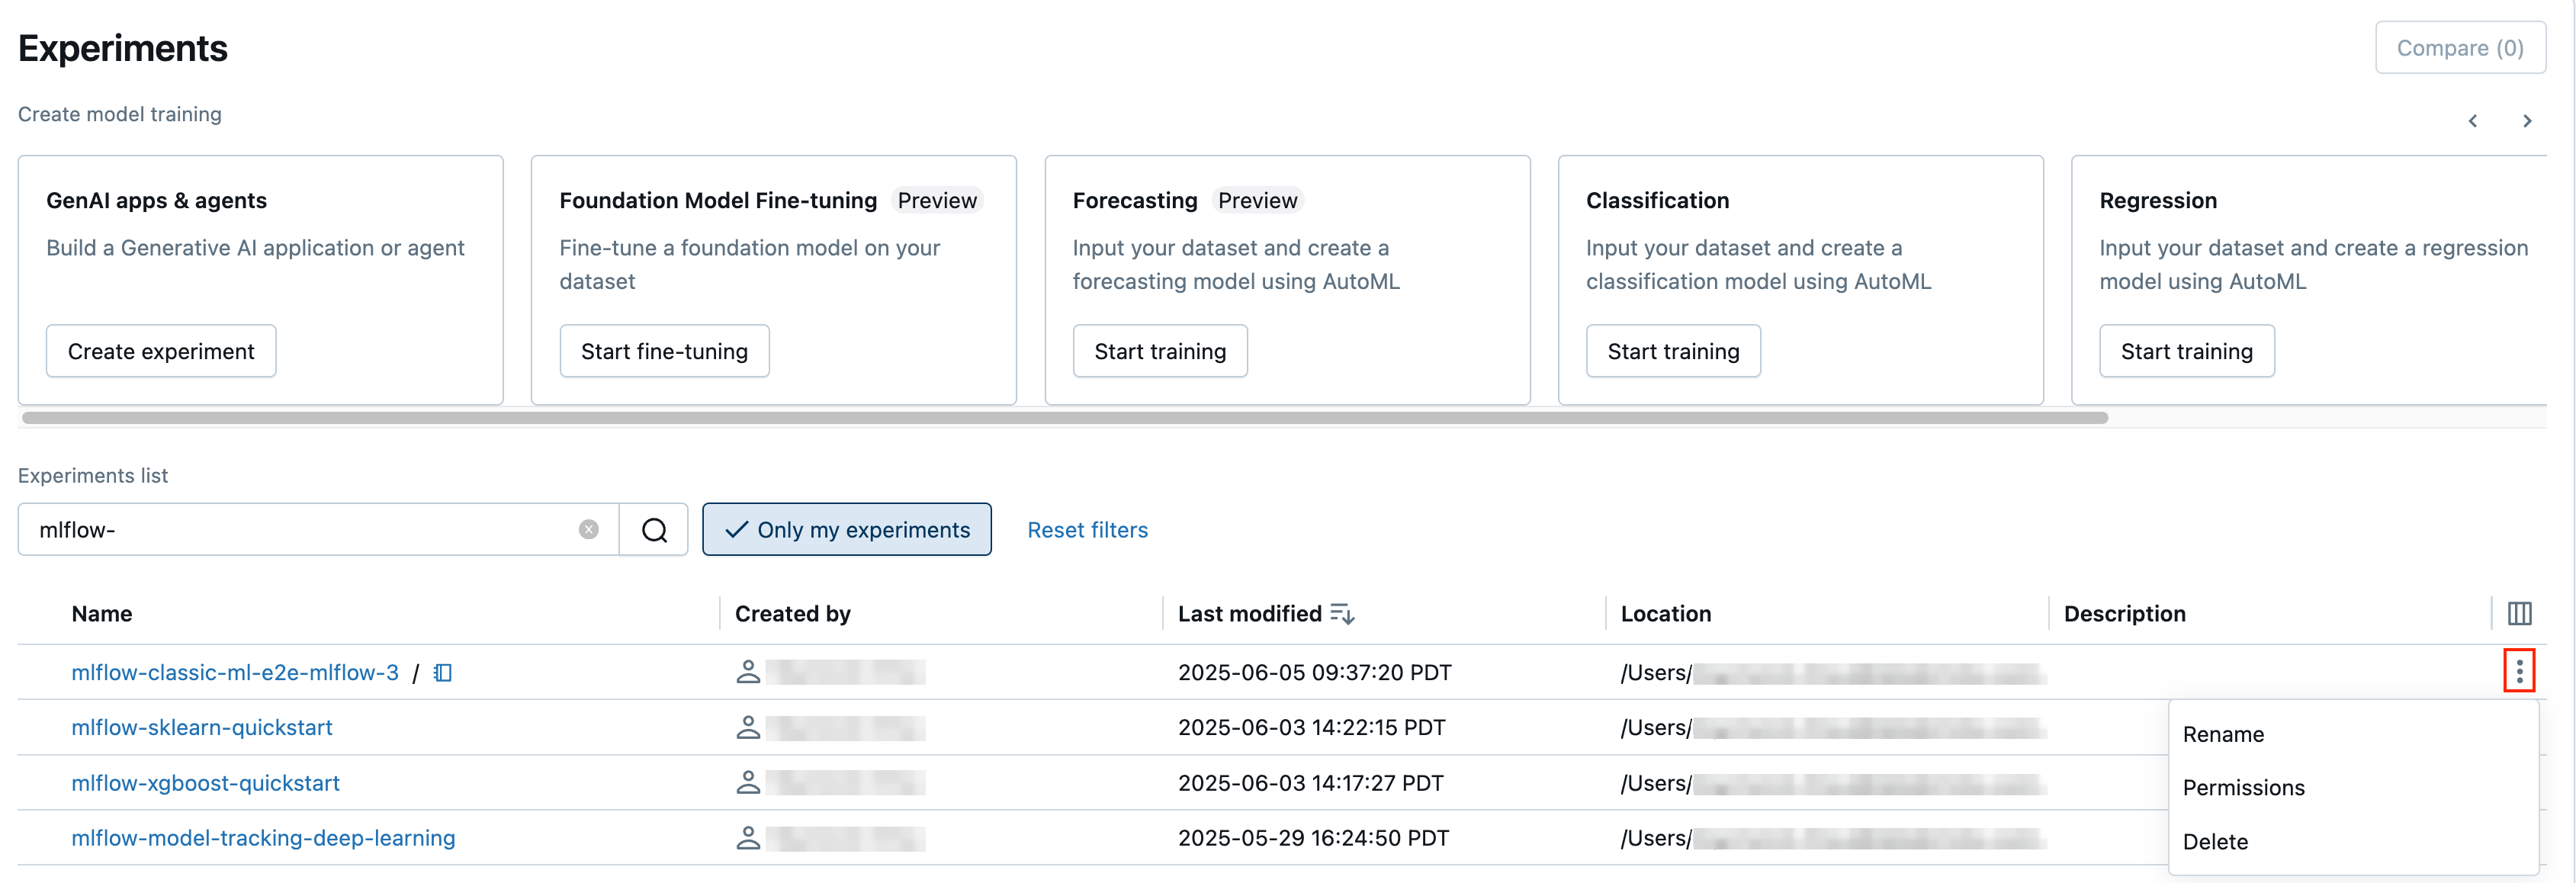
- On the Experiments page, click the kebab menu
in the rightmost column and then click Rename.
- On the experiment details page, click the kebab menu
next to Permissions and then click Rename.

You can rename a workspace experiment from the workspace. Right-click the experiment name and then click Rename.
Get experiment ID and path to experiment
On the experiment details page, you can get the path to a notebook experiment by clicking the information icon to the right of the experiment name. A pop-up note appears that shows the path to the experiment, the experiment ID, and the artifact location. You can use the experiment ID in the MLflow command
set_experiment to set the active MLflow experiment.

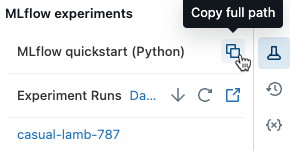
From a notebook, you can copy the full path of the experiment by clicking in the notebook's experiment sidebar.
Delete notebook experiment
Notebook experiments are part of the notebook and cannot be deleted separately. When you delete a notebook, the associated notebook experiment is deleted. When you delete a notebook experiment using the UI, the notebook is also deleted.
To delete notebook experiments using the API, use the Workspace API to ensure both the notebook and experiment are deleted from the workspace.
Delete a workspace or notebook experiment
You can delete an experiment that you own from the experiments page or from the experiment details page.
When you delete a notebook experiment, the notebook is also deleted.
- On the Experiments page, click the kebab menu
in the rightmost column and then click Delete.

- On the experiment details page, click the kebab menu
next to Permissions and then click Delete.

You can delete a workspace experiment from the workspace. Right-click the experiment name and then click Move to Trash.
Change permissions for an experiment
To change permissions for an experiment from the experiment details page, click Permissions.

You can change permissions for an experiment that you own from the Experiments page. Click the kebab menu in the rightmost column and then click Permissions.

For information on experiment permission levels, see MLflow experiment ACLs.
Copy experiments between workspaces
To migrate MLflow experiments between workspaces, you can use the community-driven open source project MLflow Export-Import.
With these tools, you can:
- Share and collaborate with other data scientists in the same or another tracking server. For example, you can clone an experiment from another user into your workspace.
- Copy MLflow experiments and runs from your local tracking server to your Databricks workspace.
- Back up mission critical experiments and models to another Databricks workspace.