Write queries and explore data in the new SQL editor
The Databricks UI includes a SQL editor that you can use to author queries, collaborate with colleagues, browse available data, and create visualizations. This page explains how to use the SQL editor to write, run, manage, and share queries.
This article explains how to use the new SQL editor. To learn about working with the legacy SQL editor, see Write queries and explore data in the legacy SQL editor.
Starting in late May 2026, the new SQL editor will be enabled by default for all workspaces. The ability to turn off the new SQL editor at the workspace level will no longer be available. Individual users will still be able to switch to the legacy editor during this period. Starting in late July 2026, the legacy SQL editor will be retired and all users will use the new SQL editor. See What's coming? for details.
Open the SQL editor
To open the SQL editor in the Databricks UI, click SQL Editor in the sidebar.
The SQL editor opens to your last open query. If no query exists, or all of your queries have been explicitly closed, the SQL editor landing page opens.
Turn on the new SQL editor
Use the New SQL editor toggle, to the right of the catalog and schema drop-down selectors, to turn the new editor on. On narrow displays, you can find the New SQL editor toggle by clicking the kebab menu to the right of the catalog and schema selectors.
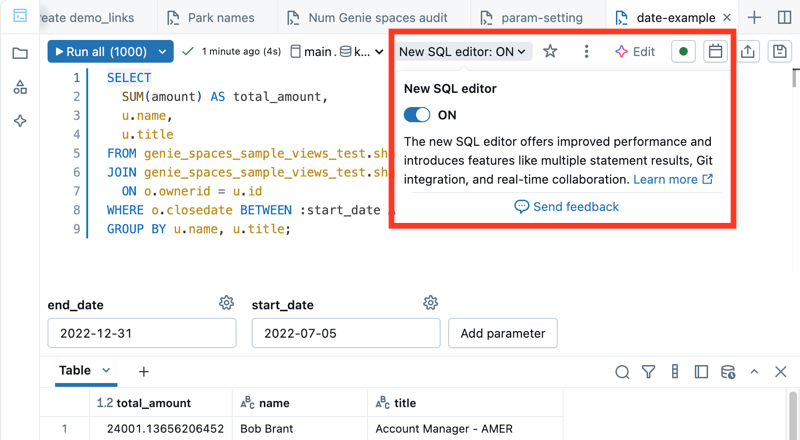
Enable the new editor for any query that you own:
- Click New SQL editor: OFF. A New SQL editor popover menu opens.
- The Apply to all of my queries checkbox is selected by default. Keep this setting to enable the editor for all queries that you own.
- To enable the new editor for the active query only, unselect the Apply to all of my queries checkbox.
- Set the New SQL editor toggle to ON.
The new SQL editor cannot be used for all queries. You cannot switch to the new SQL editor for a query if any of the following are true:
- You do not own the query.
- The query contains Query-based Dropdown Lists, which are not supported. See Use named parameter markers.
When you turn on the new SQL editor, your query reopens in the new UI. The result set is empty until you run the query.
Query results are shared with all collaborators and are limited to 64,000 rows.
Orientation
This section highlights key differences in the UI and explains how to find and use available features.

- Access the workspace file system: You can access and organize your workspace objects directly from the SQL editor.
- Use the integrated Genie Code: Chat with Genie Code to help you write, refine, or understand queries. Run code generated by Genie Code from the side panel.
- Collapse sections of code: Click the collapse arrow to the left of a code block to selectively hide and expand code sections. This can make working through large files easier.
- Open the command palette: The command palette includes common actions, keyboard shortcuts, custom themes, and links to help you quickly find what you need. After you open it, use the search bar to look for specific tools and shortcuts.
- Comment on code: Add comments to code to enhance collaboration.
- Review version history: Review recent changes to your query.
Connect to compute
You must have at least CAN USE permissions on a SQL warehouse to run queries. You can use the drop-down near the top of the editor to see available options. To filter the list, enter text in the text box.
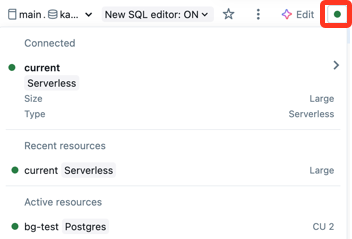
If you have a default SQL warehouse, the SQL editor automatically uses it when you create a query. If no default warehouse is set, you select from an alphabetical list of available warehouses. Subsequent queries use the last selected warehouse. To set a default warehouse, see Set a user-level default warehouse.
The icon next to the SQL warehouse indicates the status:
- Running
- Stopped
If there are no SQL warehouses in the list, contact your workspace administrator.
The selected SQL warehouse will restart automatically when you run your query. See Start a SQL warehouse to learn other ways to start a SQL warehouse.
Browse assets and get help
Use the left pane in the SQL editor to browse workspace files, view data objects, and get help from Databricks Assitant.
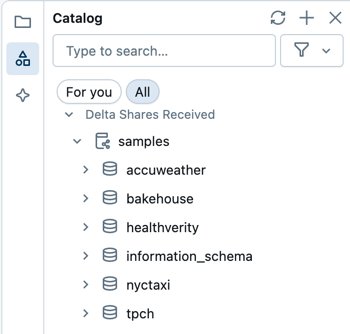
Browse workspace files
Click the folder icon to open your workspace user folder. You can navigate across all of the workspace files you have access to from this part of the UI.
Browse data objects
If you have metadata read permission, the schema browser in the SQL editor shows the available databases and tables. You can also browse data objects from Catalog Explorer.
You can navigate Unity Catalog-governed database objects in Catalog Explorer without active compute. To explore data in the hive_metastore and other catalogs not governed by Unity Catalog, you must attach to compute with appropriate privileges. See Data governance with Databricks.
If no data objects exist in the schema browser or Catalog Explorer, contact your workspace administrator.
Click near the top of the schema browser to refresh the schema. You can type in the search bar to filter assets by name. Click the
filter icon to filter objects by type.
Click the name of an object in the browser to see more details on the object. For example, click a schema name to show the tables in that schema. Click a table name to show the columns in that table.
Get help from Genie Code
Click Genie Code icon to open a chat window with Genie Code. Click a suggested question or enter your own question to interact with Genie Code.
Create a query
You can enter text to create a query in the SQL editor. You can insert elements from the schema browser to reference catalogs and tables.
-
Type your query in the SQL editor.
The SQL editor supports autocomplete. As you type, autocomplete suggests completions. For example, if a valid completion at the cursor location is a column, autocomplete suggests a column name. If you type
select * from table_name as t where t., autocomplete recognizes thattis an alias fortable_nameand suggests the columns insidetable_name. You can also use autocomplete to reference query snippets.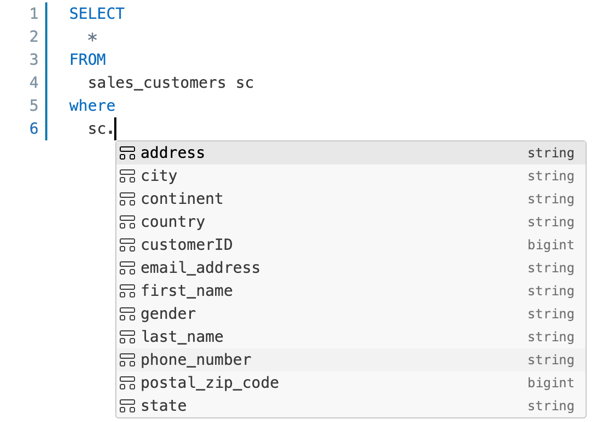
-
(Optional) When you are done editing, click Save. By default, the query is saved to your user home folder. To save the query to a different location, select the target folder and click Move.
New queries are automatically named New query with the creation timestamp appended in the title. By default, new queries created without a specific folder context are created in the Drafts folder in your home directory. When new queries are saved or renamed, they are removed from Drafts.
Query data sources
You can identify a query source using a fully-qualified table name in the query itself or by selecting a combination of catalog and schema from the drop-down selectors along with the table name in the query. A fully-qualified table name in the query overrides the catalog and schema selectors in the SQL editor. If a table or column name includes spaces, wrap those identifiers in backticks in your SQL queries.
The maximum number of results returned in a table is 64,000 rows or 10MB, whichever is smaller.
The following examples demonstrate how to query various table-like objects that you can store in a catalog.
Query a standard table or view
The following example queries a table from the samples catalog.
SELECT
  o_orderdate,
  o_orderkey,
  o_custkey,
  o_totalprice,
  o_shippriority
FROM
  samples.tpch.orders
Query a metric view
The following example queries a metric view that uses a table from the samples catalog as its source. It evaluates the three listed measures and aggregates over Order Month and Order Status. It returns results sorted by Order Month. To create a similiar metric view in your workspace, see Tutorial: Build a complete metric view with joins.
All measure evaluations must be wrapped in the MEASURE function. See measure aggregate function.
SELECT
 `Order Month`,
 `Order Status`,
 MEASURE(`Order Count`),
 MEASURE(`Total Revenue`),
 MEASURE(`Total Revenue per Customer`)
FROM
 orders_metric_view
GROUP BY ALL
ORDER BY 1 ASC;
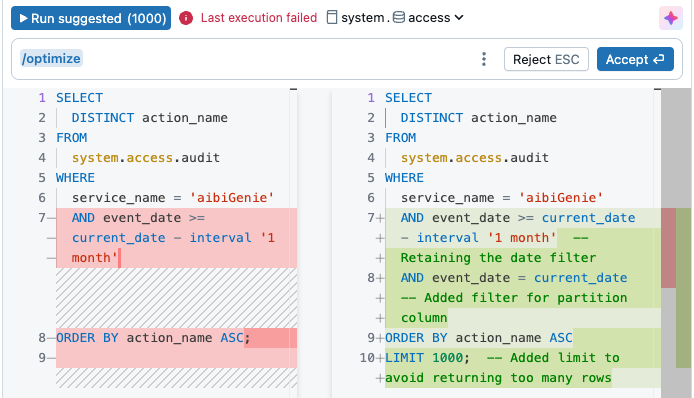
Optimize a query with Genie Code
Click the Assistant icon on the right side of the editor to get inline help and suggestions when writing queries. The
/optimize slash command prompts Assistant to evaluate and optimize queries. For more information, see Optimize Python, PySpark, and SQL code.
Edit multiple query tabs
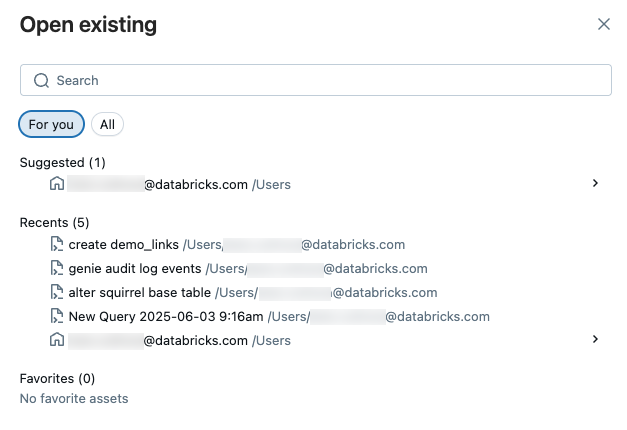
By default, the SQL editor uses tabs so you can open and edit multiple queries simultaneously. To open a new tab, click +, then select Create new query or Open existing query. Click Open existing query to see a list of queries. The For you tab offeres a curated list of sugestions based on your usage. Use the All tab to find any query that you have access to.
Run a single query or multi-statement queries
You can write multi-statement queries into a single editor tab. To use multiple query statements in a single tab, end each statement with a semicolon (;).
To run a single query:
- Select a SQL warehouse.
- Highlight a query in the SQL editor (if multiple queries are in the query pane).
- Press Ctrl/Cmd + Enter or click Run (1000) to display the results as a table in the results pane.
By default, Run all statements and Limit 1000 are selected.
- To run only the active statement, unselect Run all statements.
- If a query is saved with the Limit 1000 setting, this setting applies to all query runs. To return all rows (up to 64,000 rows or 10 MB, whichever is smaller), clear LIMIT 1000 from the Run (1000) drop-down menu. To specify a different limit on the number of rows, add a
LIMITclause in your query.
Terminate a query
To terminate a query while it is running, click Cancel. An administrator can stop an running query that another user started by viewing the Terminate an executing query.
Share a query
The new SQL editor handles permissions in two parts:
Interactive execution: Queries in the new SQL editor always run using Run as viewer credentials. Query results are accessible to anyone who has access to the query. Users with CAN EDIT permissions or higher can modify the shared query draft. Additionally, unsaved edits are visible to anyone with CAN VIEW permissions or above. Users must have at least CAN USE permission on the associated warehouse to run queries.
Credential settings: The permission settings for legacy alerts and Workflows are the same as those for the legacy SQL editor. Depending on your preferences, these assets can be run using either the owner's or the viewer's credentials.
See Configure query permissions to learn about Run as owner and Run as viewer credential settings. See Query ACLs to learn how to manage access to the query object.
Collaborate on queries in real time

After sharing the query, you can coauthor or debug queries live through collaborative editing. Editors can also comment on individual lines of code to ask questions or add suggestions.
Source control a query
Databricks SQL query files (extension: .dbquery.ipynb) are supported in Databricks Git folders. You can use a Git folder to source control your query files and to share them in other workspaces with Git folders that access the same Git repository. If you choose to opt out of the new SQL editor after committing or cloning a query in a Databricks Git folder, delete and reclone that Git folder to avoid unexpected behaviors.
Copy the legacy query ID
To get the legacy query ID for a query that has been migrated to the new SQL editor, copy it from the File menu. This can be useful for API calls or other integrations that reference the legacy query ID.
- Open the query in the new SQL editor.
- Click the kebab menu
at the top of the editor.
- Click File > Copy legacy query ID.
Save a query
Query content in the new SQL editor is continuously autosaved. The Save button controls whether the draft query content should be applied to related assets, like workflows or legacy alerts. If the query is shared with the Run as owner credential, only the query owner can use the Save button to propagate changes. If the credential is set to Run as viewer, any user with at least CAN MANAGE permission can save the query.
View query results
You can compare the output from each statement with multiple result statements. When you run multiple SQL statements from a single edit window, you can use the UI in the Output panel near the bottom of the screen to scroll through the different result sets.

You can interact with and explore your query results using the result pane. The result pane includes the following features for exploring results.
Visualizations
Click the to add a visualization. Visualizations can help explore the result set. See Notebook and SQL editor visualization types for a complete list of available visualization types.
Click the on a visualization tab to show additional options.
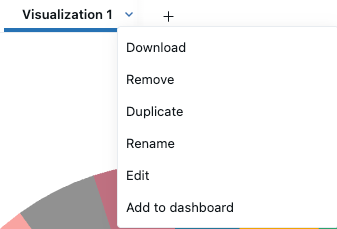
- Click Download to download the data represetned in the visualization as a CSV, TSV, or Excel file.
- Click Remove to delete the visualization.
- Click Duplicate to clone the results tab.
- Click Rename to retitle the visualization.
- Click Edit to edit the visualization.
- Click Add to dashboard to copy the query and visualization to a new AI/BI dashboard.
- Select Create new dashboard or Add to existing dashboard.
- Create new dashboard: Creates a new dashboard that includes all the visualizations associated with the query. You are prompted to choose a name for the new dashboard. The new dashboard is saved to your home folder.
- Add to existing dashboard: Adds your query and associated visualizations to an existing dashboard. Use the drop-down menu to choose the dashboard that the dataset and visualization should be added to.
Download results
You can download results as a CSV or Excel file. CSV downloads support up to approximately 5GB of data. Click the in a results tab to view download options. The final file download size might be slightly more or less than 5GB, as the 5GB limit is applied to an earlier step than the final file download.
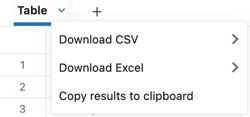
If you cannot download a query, your workspace administrator has disabled download for your workspace.
Filters
Filters allow you to limit the result set after a query has run. You can apply filters to selectively show different subsets of the data. Use Genie Code to help you add a filter for results.
To add a filter:
- Click
the filter icon.
- Enter text to describe the kind of filter you want to apply. A named filter is applied to the result set.
To edit a filter:
- Click the name of the filter.
- Use the drop-down menus and text fields to adjust the filter settings.
- (Optional) Select Case senstitive to make the filter case sensitive.
- (Optional) Click Add OR condition to add an additional filter.
Add parameters
Parameters allow you to limit the result set by substituting values into a query at runtime. See Use named parameter markers to learn how to apply parameters.
Parameter syntax changes
Queries written in the legacy SQL editor that use double curly braces ({{}}) to mark parameters must be modified to run in the new SQL editor. The new SQL editor uses the same parameter syntax as other Databricks tools, like AI/BI dashboards, Genie Spaces, and notebooks.
Parameters in the new SQL editor are defined using named parameter syntax. Named parameters are parameters in a query that are prefixed with a colon, for example :parameter_name.
See Named parameter markers for the SQL referenece documentation. See Named parameter syntax examples for examples of converting parameter syntax from the classic SQL editor to named parameter markers.
Supported filter types
The following table shows filter types supported in the new SQL editor. The second column indicates whether the filter also works in the legacy SQL editor.
Filter type | Supported in legacy editor |
|---|---|
Is equal to | Yes |
Is not equal to | No |
Is one of | Yes |
Is not one of | No |
Contains | Yes |
Does not contain | No |
Starts with | Yes |
Does not start with | No |
Ends with | No |
Does not end with | No |
Is null | No |
Is not null | No |
Greater than | No |
Greater than or equal to | No |
Less than | No |
Less than or equal to | No |
Between | Yes |
Before | No |
After | No |
Is true | Yes |
Is false | Yes |
OR conditions | No |
Use keyboard shortcuts
The new SQL editor includes many built-in keyboard shortcuts to help you work quickly. The following table identifies commonly used keyboard shortcuts.
Function | macOS shortcut | Windows shortcut |
|---|---|---|
Run a query |
|
|
Run a single highlighted statement |
|
|
Autocomplete |
|
|
Increase font size |
|
|
Decrease font size |
|
|
Format SQL code |
|
|
View all shortcuts |
|
|
Disable the new SQL editor
Starting in late May 2026, the workspace-level opt-out for the new SQL editor will be removed. Individual users can still switch to the legacy editor until late July 2026, when the legacy SQL editor will be fully retired. See What's coming? for details.
To disable the new SQL editor:
- Click New SQL editor: ON. A New SQL editor popover menu opens.
- Set the New SQL Editor toggle to OFF.
- In the confirmation dialog, choose to disable the new editor for the active query only or for all eligible queries.
- The Disable for all eligible queries is unselected. Keep this setting if you want to disable the new editor for only the active query.
- To disable the new SQL editor for all your queries, select the checkbox Disable for all eligible queries.
To prevent queries from automatically opening in the new SQL editor:
- In the Databricks workspace, click your username in the top bar and select Settings.
- In the left pane, under User, click the Developer tab.
- Turn off Create and open all eligible queries in the new SQL editor.
Workspace admins can turn off this feature at the workspace level by visiting the preview portal and searching for SQL editor. See Manage Databricks previews.