Tutorial: Develop a Node.js Databricks app
This tutorial shows you how to create a simple Node.js app in Databricks Apps that serves a web page with a dynamic chart using Chart.js and Express. The app includes:
- A styled homepage that renders a chart
- An API endpoint that returns mock time-series sales data
- A dynamic port using an environment variable
Prerequisites
Before you complete this tutorial:
- Make sure that your Databricks workspace and local development environment are configured correctly. See Set up your Databricks Apps workspace and development environment.
- Create a custom Databricks app to serve as the container for your Node.js code. See Create a custom Databricks app.
Step 1: Install dependencies
Open a terminal and run the following commands to:
- Install Node.js
- Create a local directory for the source and configuration files for your app
- Install Express
brew install node
mkdir my-node-app
cd my-node-app
npm install express
Step 2: Define your app logic
Create a file called app.js with the following contents:
import express from 'express';
import path from 'path';
import { fileURLToPath } from 'url';

const app = express();
const port = process.env.PORT || 8000;

const __dirname = path.dirname(fileURLToPath(import.meta.url));
app.use('/static', express.static(path.join(__dirname, 'static')));

// Serve chart page
app.get('/', (req, res) => {
  res.sendFile(path.join(__dirname, 'static/index.html'));
});

// Serve mock time-series data
app.get('/data', (req, res) => {
  const now = Date.now();
  const data = Array.from({ length: 12 }, (_, i) => ({
    date: new Date(now - i * 86400000).toISOString().slice(0, 10),
    sales: Math.floor(Math.random() * 1000) + 100,
  })).reverse();
  res.json(data);
});

app.listen(port, () => {
  console.log(`🚀 App running at http://localhost:${port}`);
});
This code creates an Express server that:
- Serves an HTML page from the
/staticdirectory - Responds to
/datawith mock sales data - Listens on the port defined by the
PORTenvironment variable (or 8000 by default)
Step 3: Add a static HTML file
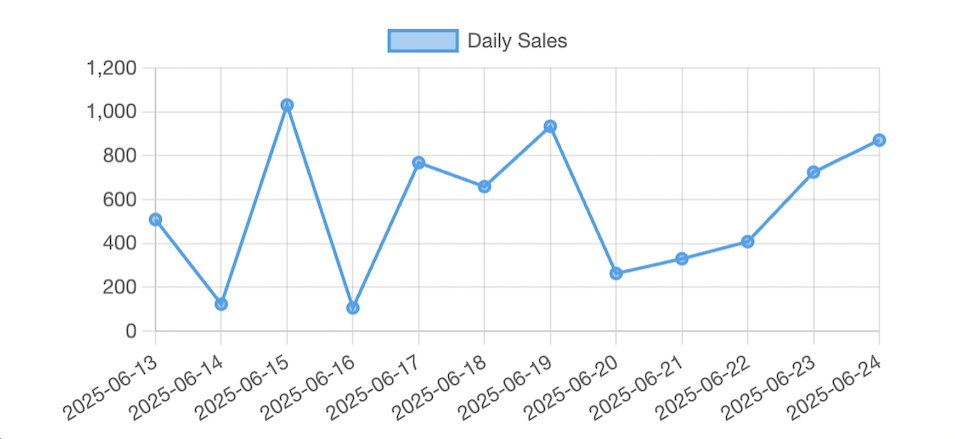
Create a file at static/index.html that loads Chart.js and renders a line chart. The chart automatically fetches mock data from the /data API and renders it in the browser.
<!DOCTYPE html>
<html>
  <head>
    <title>Sales Dashboard</title>
    <script src="https://cdn.jsdelivr.net/npm/chart.js"></script>
    <style>
      body {
        font-family: sans-serif;
        padding: 2rem;
      }
      canvas {
        max-width: 100%;
        height: 400px;
      }
    </style>
  </head>
  <body>
    <h1>📈 Sales Dashboard</h1>
    <canvas id="salesChart"></canvas>

    <script>
      async function renderChart() {
        const response = await fetch('/data');
        const data = await response.json();

        const ctx = document.getElementById('salesChart').getContext('2d');
        new Chart(ctx, {
          type: 'line',
          data: {
            labels: data.map((d) => d.date),
            datasets: [
              {
                label: 'Daily Sales',
                data: data.map((d) => d.sales),
                borderWidth: 2,
                fill: false,
              },
            ],
          },
          options: {
            responsive: true,
            scales: {
              y: {
                beginAtZero: true,
              },
            },
          },
        });
      }

      renderChart();
    </script>
  </body>
</html>
Step 4: Define dependencies
Create a package.json file that declares Express as a dependency and sets up your start script:
{
  "name": "databricks-chart-app",
  "version": "1.0.0",
  "type": "module",
  "main": "app.js",
  "scripts": {
    "start": "node app.js"
  },
  "dependencies": {
    "express": "^4.19.2"
  }
}
Step 5: Run the app locally
To test the app locally, run the following commands:
npm install
npm run start
Navigate to http://localhost:8000 to see a dynamic chart of mock sales data over the past 12 days.
Next steps
- Deploy the app. See Deploy a Databricks app.
- Replace mock data with data from Unity Catalog or an external API.
- Add UI filters, such as a date range or product category.
- Secure your app using Databricks secrets or OAuth.