Monitor a database instance
Lakebase Provisioned is the original Lakebase offering that uses provisioned compute you scale manually. For supported regions, see Region availability. For the latest version of Lakebase, with autoscaling compute, scale-to-zero, branching, and instant restore, see Lakebase Autoscaling.
New Lakebase instances will be created as Autoscaling projects. Rollout starts March 12, 2026. For details, see Autoscaling by default.
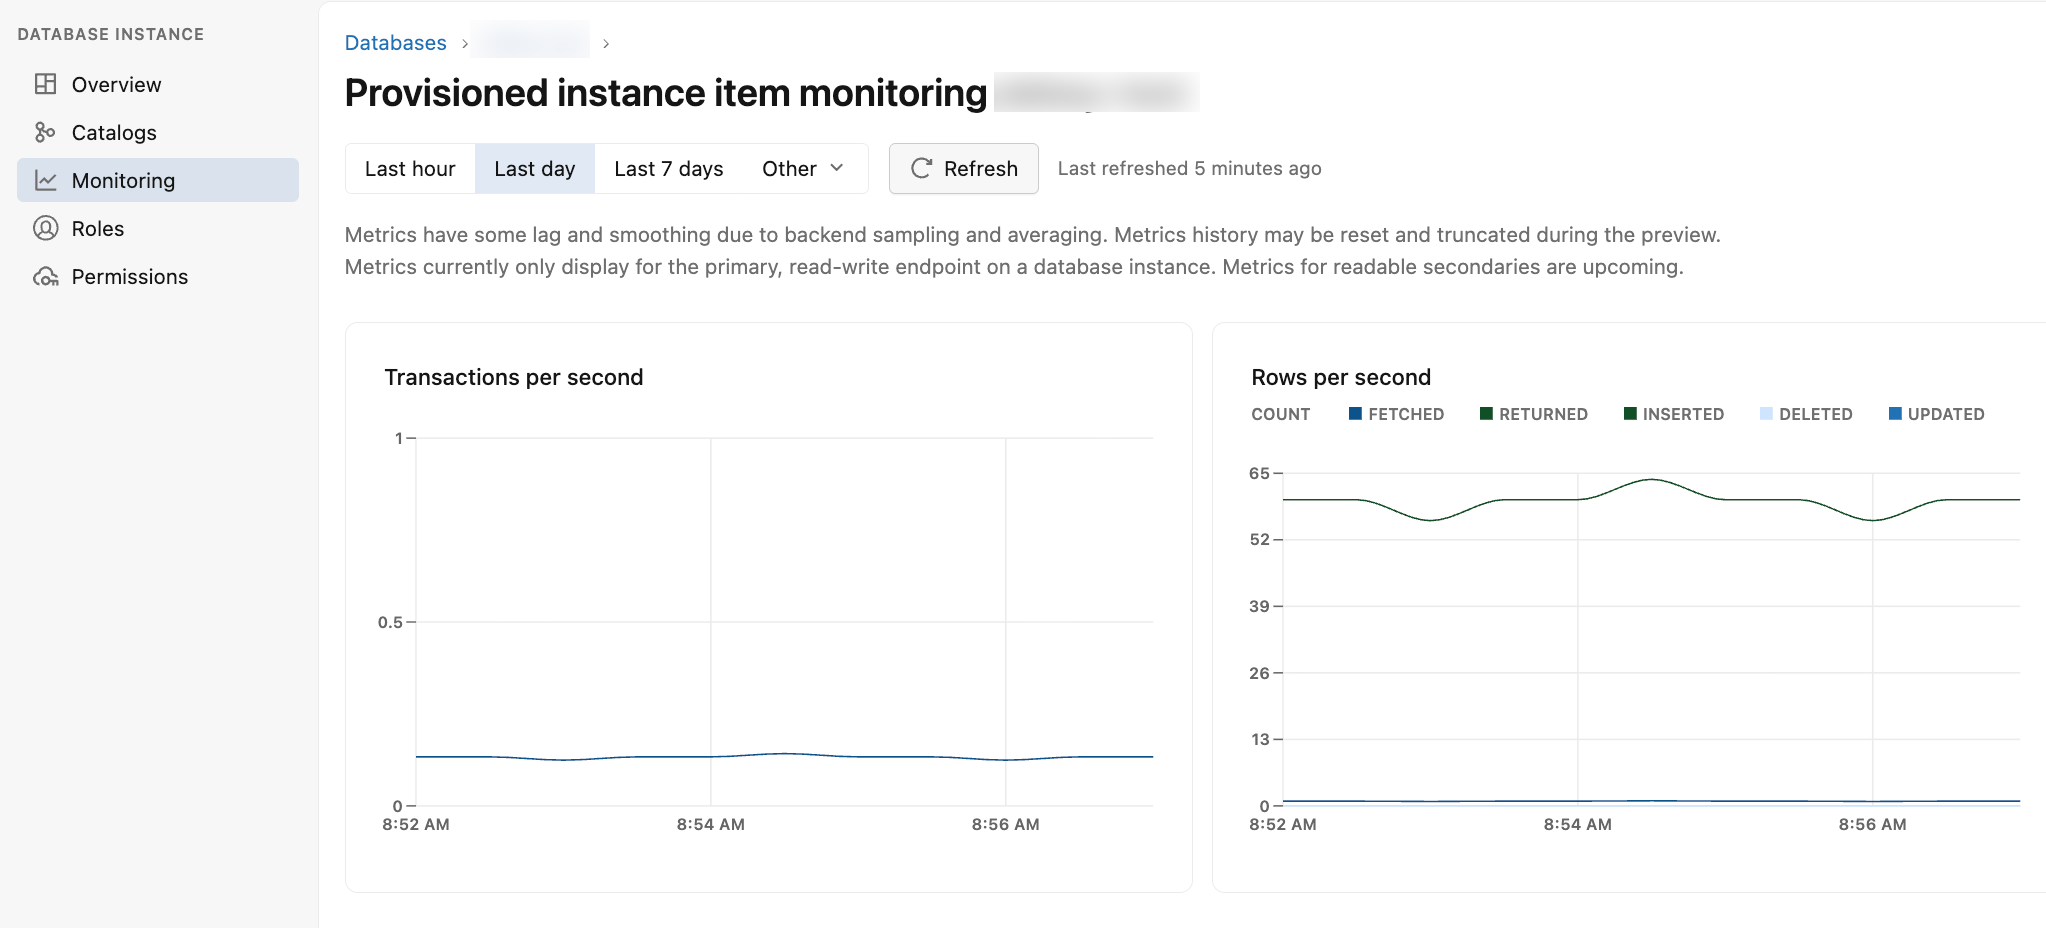
This page explains how to monitor the performance of your Lakebase database instance using the Metrics tab on the instance details page.
Access metrics
To access metrics for your instance:
- Click
Apps in the top right corner and select Lakebase Postgres.
- Click Provisioned to open the Provisioned instances page.
- Select the database instance you want to monitor.
- Select Monitoring from the Lakebase App sidebar.

Available metrics
Use the following metrics to analyze performance trends, identify potential bottlenecks, and evaluate whether to optimize application usage or scale your instance:
-
Transactions per second: Shows committed transaction throughput. Use this to understand workload patterns and identify peak transaction periods. If this value is consistently high, consider optimizing client behavior or increasing the size of the instance.
-
Rows per second: Displays the number of rows fetched, returned, inserted, updated, and deleted. Rows fetched refers to the number of rows returned to clients. Rows returned refers to the number of rows read by queries. Helps diagnose the type of workload and its impact on the system. If performance is constrained, consider adding indexes or optimizing query patterns.
-
Open connections: Displays the number of open active connections. Connections consume instance resources. Use this to evaluate whether client-side connection pooling is needed. Refer to limits for the maximum number of allowed connections.
-
Storage utilization: Indicates current storage usage for the instance. If utilization approaches Lakebase Provisioned limits, remove unnecessary data or indexes. Alternatively, contact support to request a quota increase.
-
CPU utilization (%): Measures CPU usage for the database instance. High CPU usage might indicate a computation-heavy workload. Consider application-side optimizations or increasing the size of the instance.
-
Page read throughput (%): Reflects how close the instance is to its page read capacity, typically caused by cache misses. If the Page read throughput value is high, reduce the workload or working set, add indexes, cache queries on the client side, or streamline the data.
-
Buffer cache hit rate (%): Indicates the percentage of reads served from memory. High-performance workloads should see values above 99%. Low rates suggest the workload exceeds cache capacity or could benefit from optimizations.
-
Local SSD cache hit rate (%): Tracks the percentage of reads served from the SSD cache after a buffer cache miss. A low value may increase page read throughput. Use similar optimizations as with buffer cache, or consider a larger instance.
-
Deadlocks per second: Measures how often transactions encounter deadlocks. These typically occur when multiple transactions access the same resources in conflicting order. Investigate and refactor workloads to prevent deadlocks.