Conduct your own LLM endpoint benchmarking
The topics described in this page apply to provisioned throughput workloads that serve models that provision inference capacity based on tokens per second. The following models apply:
- Meta Llama 3.3
- Meta Llama 3.2 3B
- Meta Llama 3.2 1B
- Meta Llama 3.1
- GTE v1.5 (English)
- BGE v1.5 (English)
- DeepSeek R1 (not available in Unity Catalog)
- Meta Llama 3
- Meta Llama 2
- DBRX
- Mistral
- Mixtral
- MPT
See Model units in provisioned throughput for supported models that use model units (not tokens per second) to provision inference capacity.
This article provides a Databricks recommended notebook example for benchmarking an LLM endpoint. It also includes a brief introduction to how Databricks performs LLM inference and calculates latency and throughput as endpoint performance metrics.
LLM inference on Databricks measures tokens per second for provisioned throughput mode for Foundation Model APIs. See Deploy legacy provisioned throughput models.
Benchmarking example notebook
You can import the following notebook into your Databricks environment and specify the name of your LLM endpoint to run a load test.
Benchmarking an LLM endpoint
LLM inference introduction
LLMs perform inference in a two-step process:
- Prefill, where the tokens in the input prompt are processed in parallel.
- Decoding, where text is generated one token at a time in an auto-regressive manner. Each generated token is appended to the input and fed back into the model to generate the next token. Generation stops when the LLM outputs a special stop token or when a user-defined condition is met.
Most production applications have a latency budget, and Databricks recommends you maximize throughput given that latency budget.
- The number of input tokens has a substantial impact on the required memory to process requests.
- The number of output tokens dominates overall response latency.
Databricks divides LLM inference into the following sub-metrics:
- Time to first token (TTFT): This is how quickly users start seeing the model's output after entering their query. Low waiting times for a response are essential in real-time interactions, but less important in offline workloads. This metric is driven by the time required to process the prompt and then generate the first output token.
- Time per output token (TPOT): Time to generate an output token for each user that is querying the system. This metric corresponds with how each user perceives the “speed” of the model. For example, a TPOT of 100 milliseconds per token would be 10 tokens per second, or ~450 words per minute, which is faster than a typical person can read.
Based on these metrics, total latency and throughput can be defined as follows:
- Latency = TTFT + (TPOT) * (the number of tokens to be generated)
- Throughput = number of output tokens per second across all concurrency requests
On Databricks, LLM serving endpoints are able to scale to match the load sent by clients with multiple concurrent requests. There is a trade-off between latency and throughput. This is because, on LLM serving endpoints, concurrent requests can be and are processed at the same time. At low concurrent request loads, latency is the lowest possible. However, if you increase the request load, latency might go up, but throughput likely also goes up. This is because two requests worth of tokens per second can be processed in less than double the time.
Therefore, controlling the number of parallel requests into your system is core to balancing latency with throughput. If you have a low latency use case, you want to send fewer concurrent requests to the endpoint to keep latency low. If you have a high throughput use case, you want to saturate the endpoint with lots of concurrency requests, since higher throughput is worth it even at the expense of latency.
- High throughput use cases might include batch inferences and other non-user facing tasks.
- Low latency use cases might include real-time applications that require immediate responses.
Databricks benchmarking harness
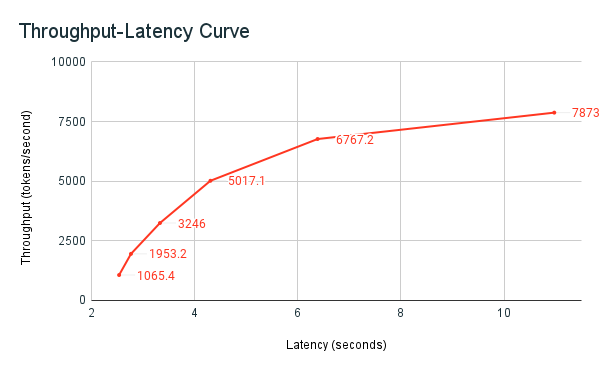
The previously shared benchmarking example notebook is the Databricks benchmarking harness. The notebook displays the total latency across all requests and throughput metrics and plots the throughput versus latency curve across different numbers of parallel requests. Databricks endpoint autoscaling strategy balances between latency and throughput. In the notebook, you observe that latency and throughput increase as more concurrent users query the endpoint.
However, you also begin to see that as the number of parallel requests increases, the throughput begins to plateau, reaching a limit of about 8000 tokens per second. This plateau occurs because the provisioned throughput for the endpoint limits the number of workers and parallel requests that can be made. As more requests are made beyond what the endpoint can handle simultaneously, the total latency continues to increase as additional requests wait in the queue.
More details on the Databricks philosophy about LLM performance benchmarking is described in the LLM Inference Performance Engineering: Best Practices blog.