Jobs timeline
The jobs timeline is a great starting point for understanding your pipeline or query. It gives you an overview of what was running, how long each step took, and if there were any failures along the way.
How to open the jobs timeline
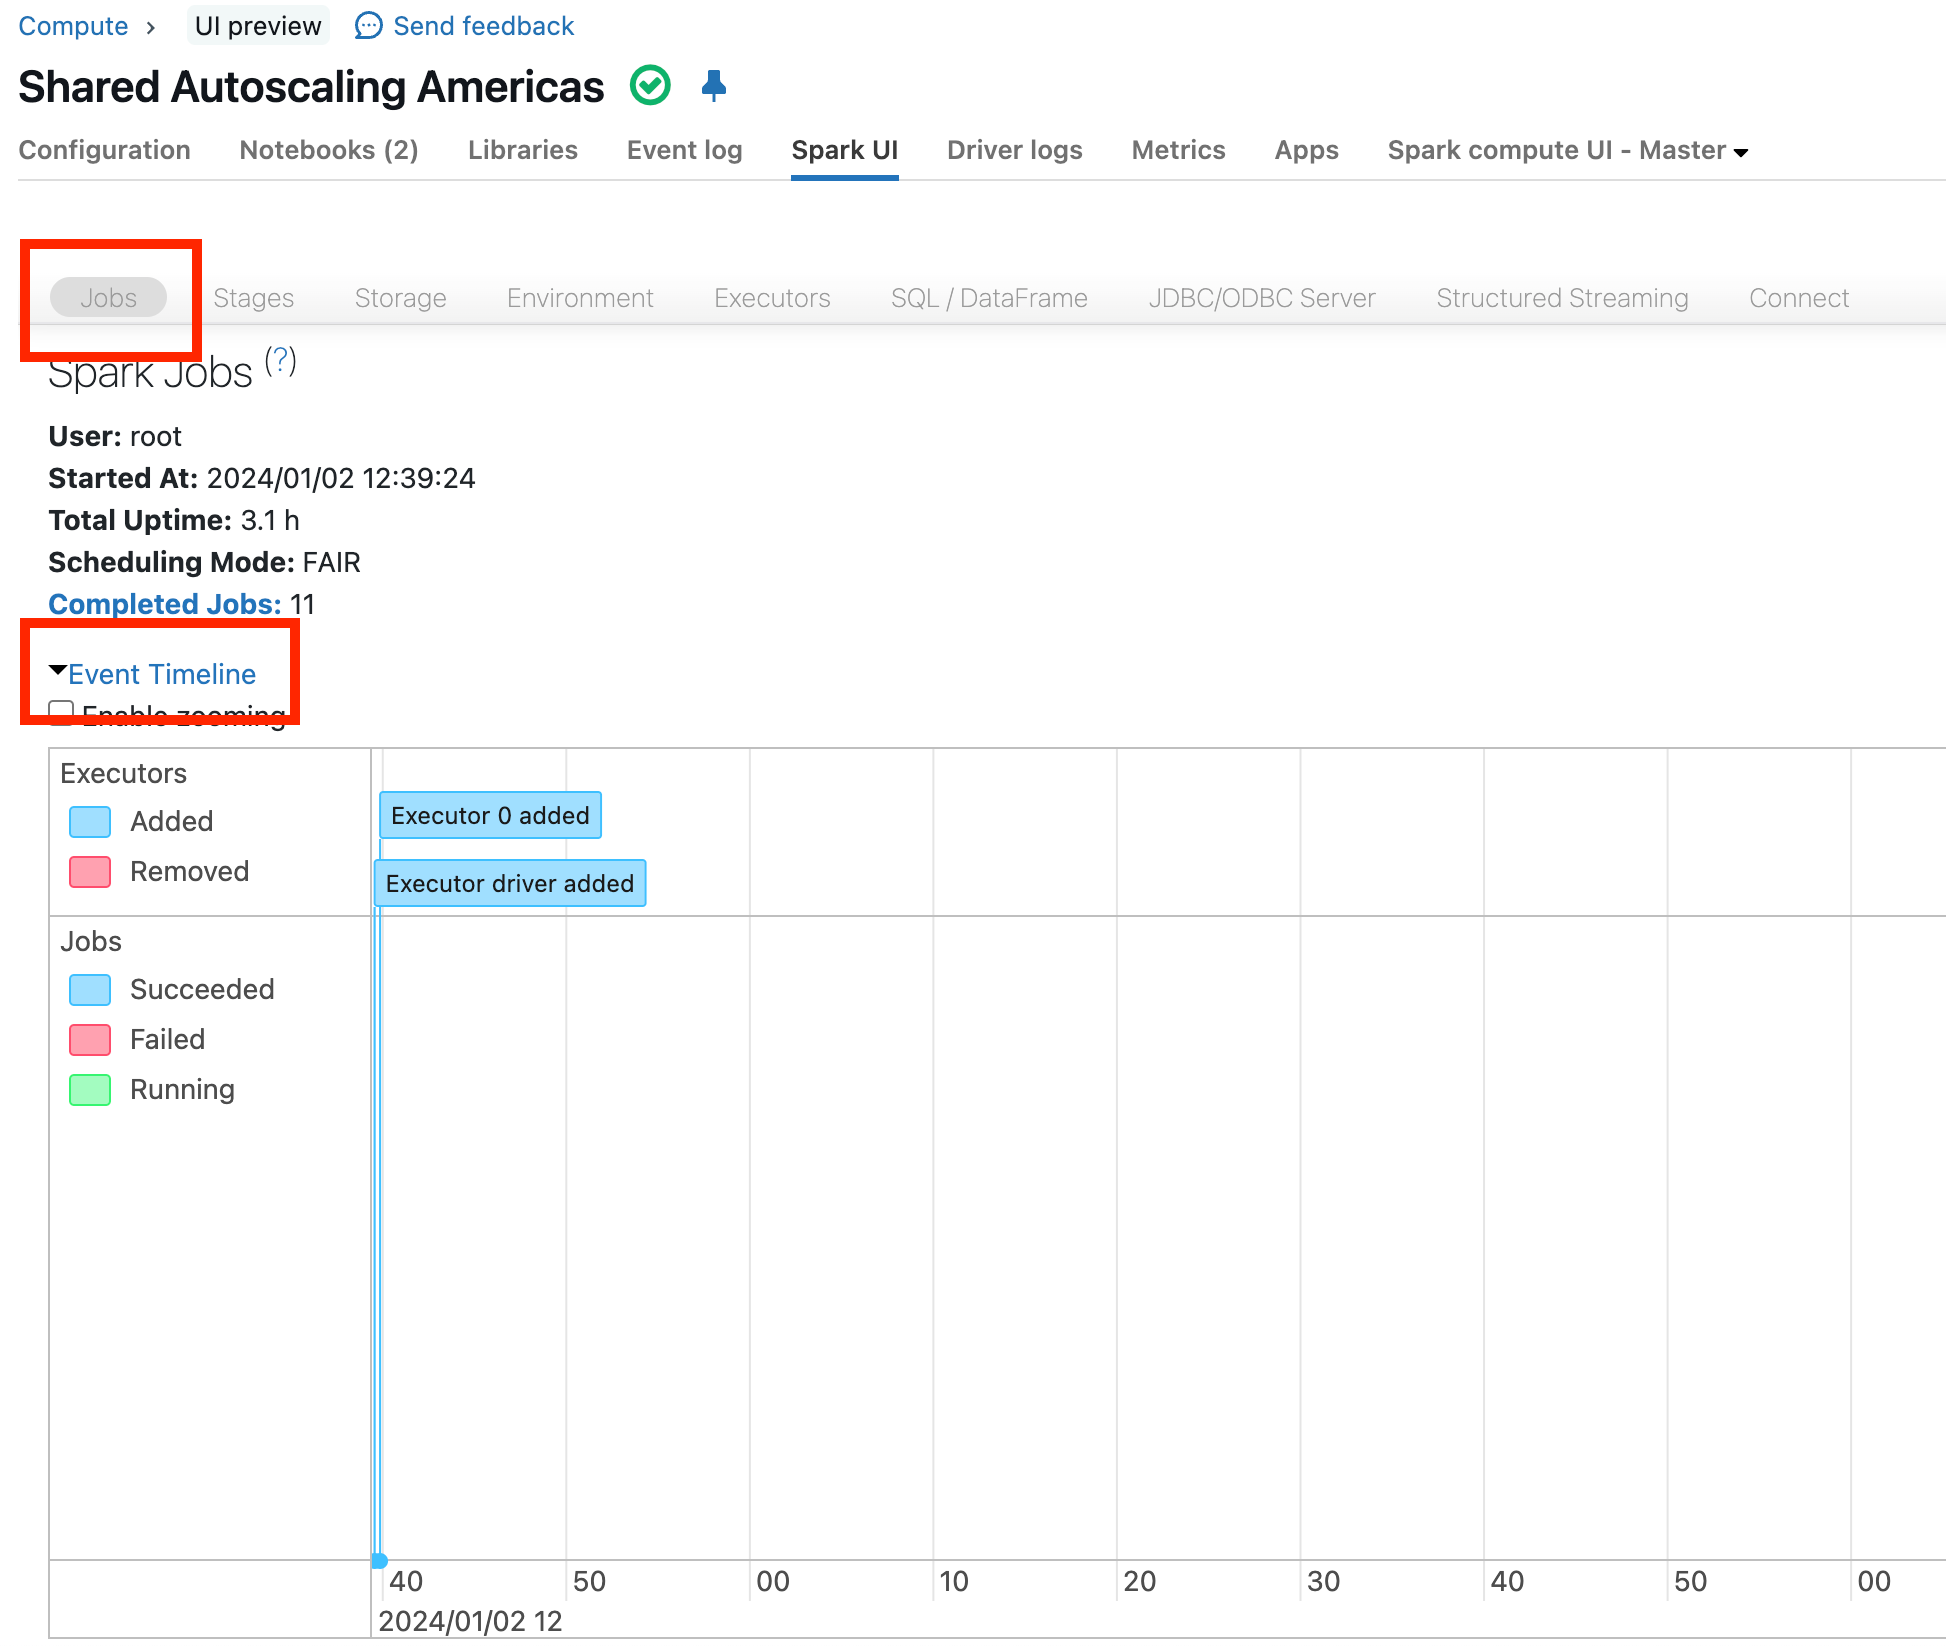
In the Spark UI, click on Jobs and Event Timeline as highlighted in red in the following screenshot. You will see the timeline. This example shows the driver and executor 0 being added:
What to look for
The sections below explain how to read the event timeline to discover the possible cause of your performance or cost issue. If you notice any of these trends in your timeline, the end of each corresponding section contains a link to an article that provides guidance.
Failing jobs or failing executors
Here's an example of a failed job and removed executors, indicated by a red status, in the event timeline.
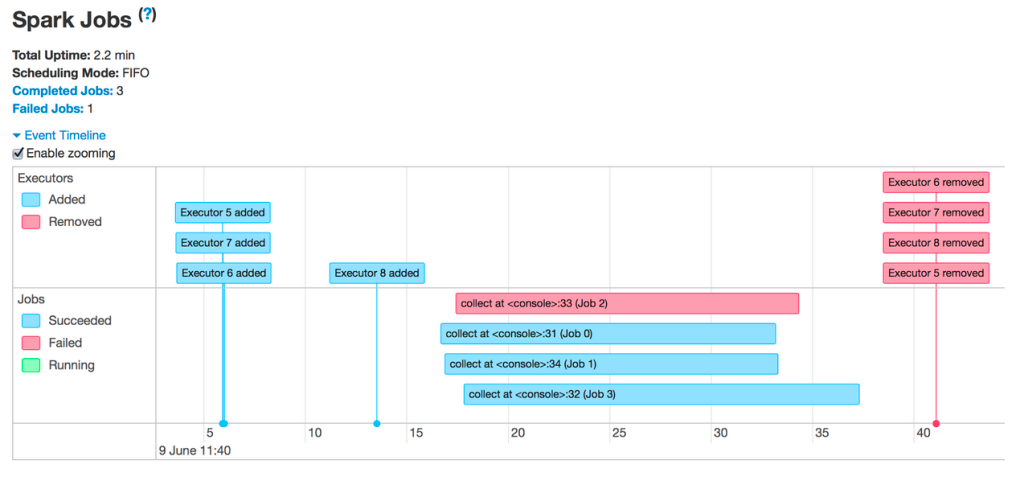
If you see failing jobs or failing executors, see Failing jobs or executors removed.
Gaps in execution
Look for gaps of a minute or more, such as in this example:
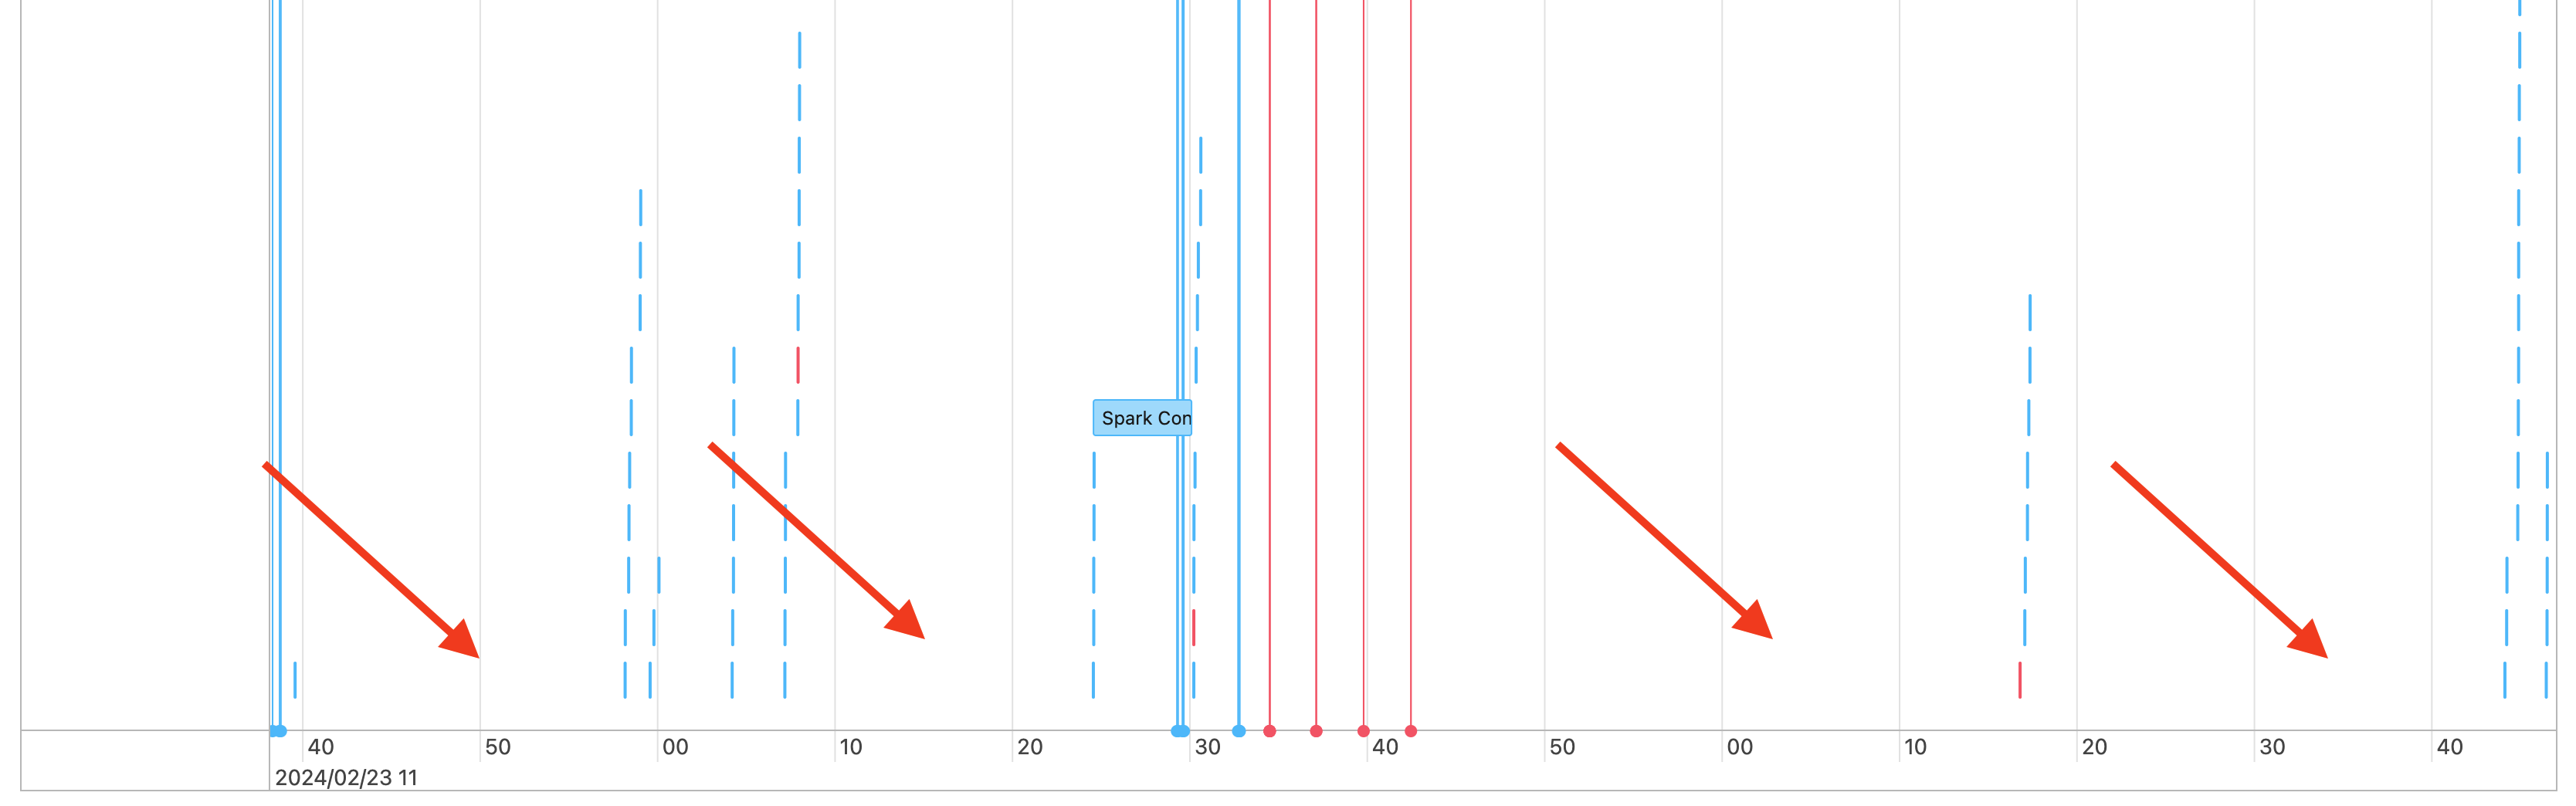
This example has several gaps, a few of which are highlighted by the red arrows. If you see gaps in your timeline, are they a minute or more? Short gaps are to be expected as the driver coordinates work. If you do have longer gaps, are they in the middle of a pipeline? Or is this cluster constantly running and so the gaps are explained by pauses in activity? You might be able to determine this based on what time your workload started and ended.
If you see long unexplained gaps in the middle of a pipeline, see Gaps between Spark jobs.
Long jobs
Is the timeline dominated by one or a few long jobs? These long jobs would be something to investigate. In the following example, the workload has one job that's much longer than the others. This is a good target for investigation.
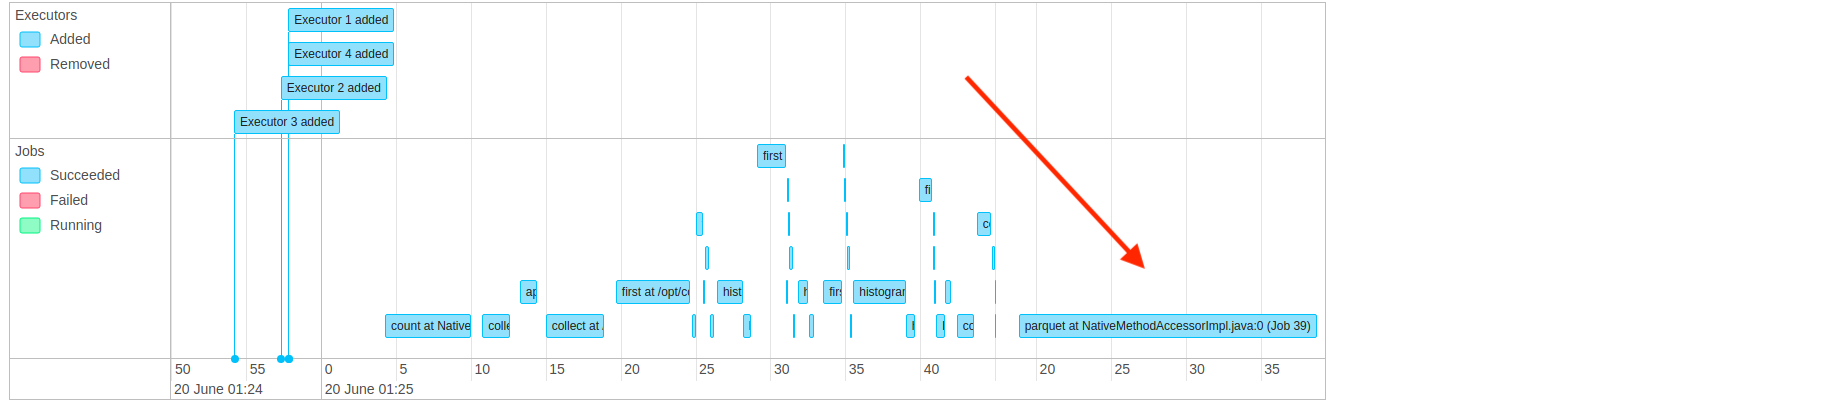
Click on the longest job to dig in. For information about investigating this long stage, see Diagnosing a long job in Spark.
Many small jobs
What we're looking for here is a timeline dominated by tiny jobs. It might look something like this:
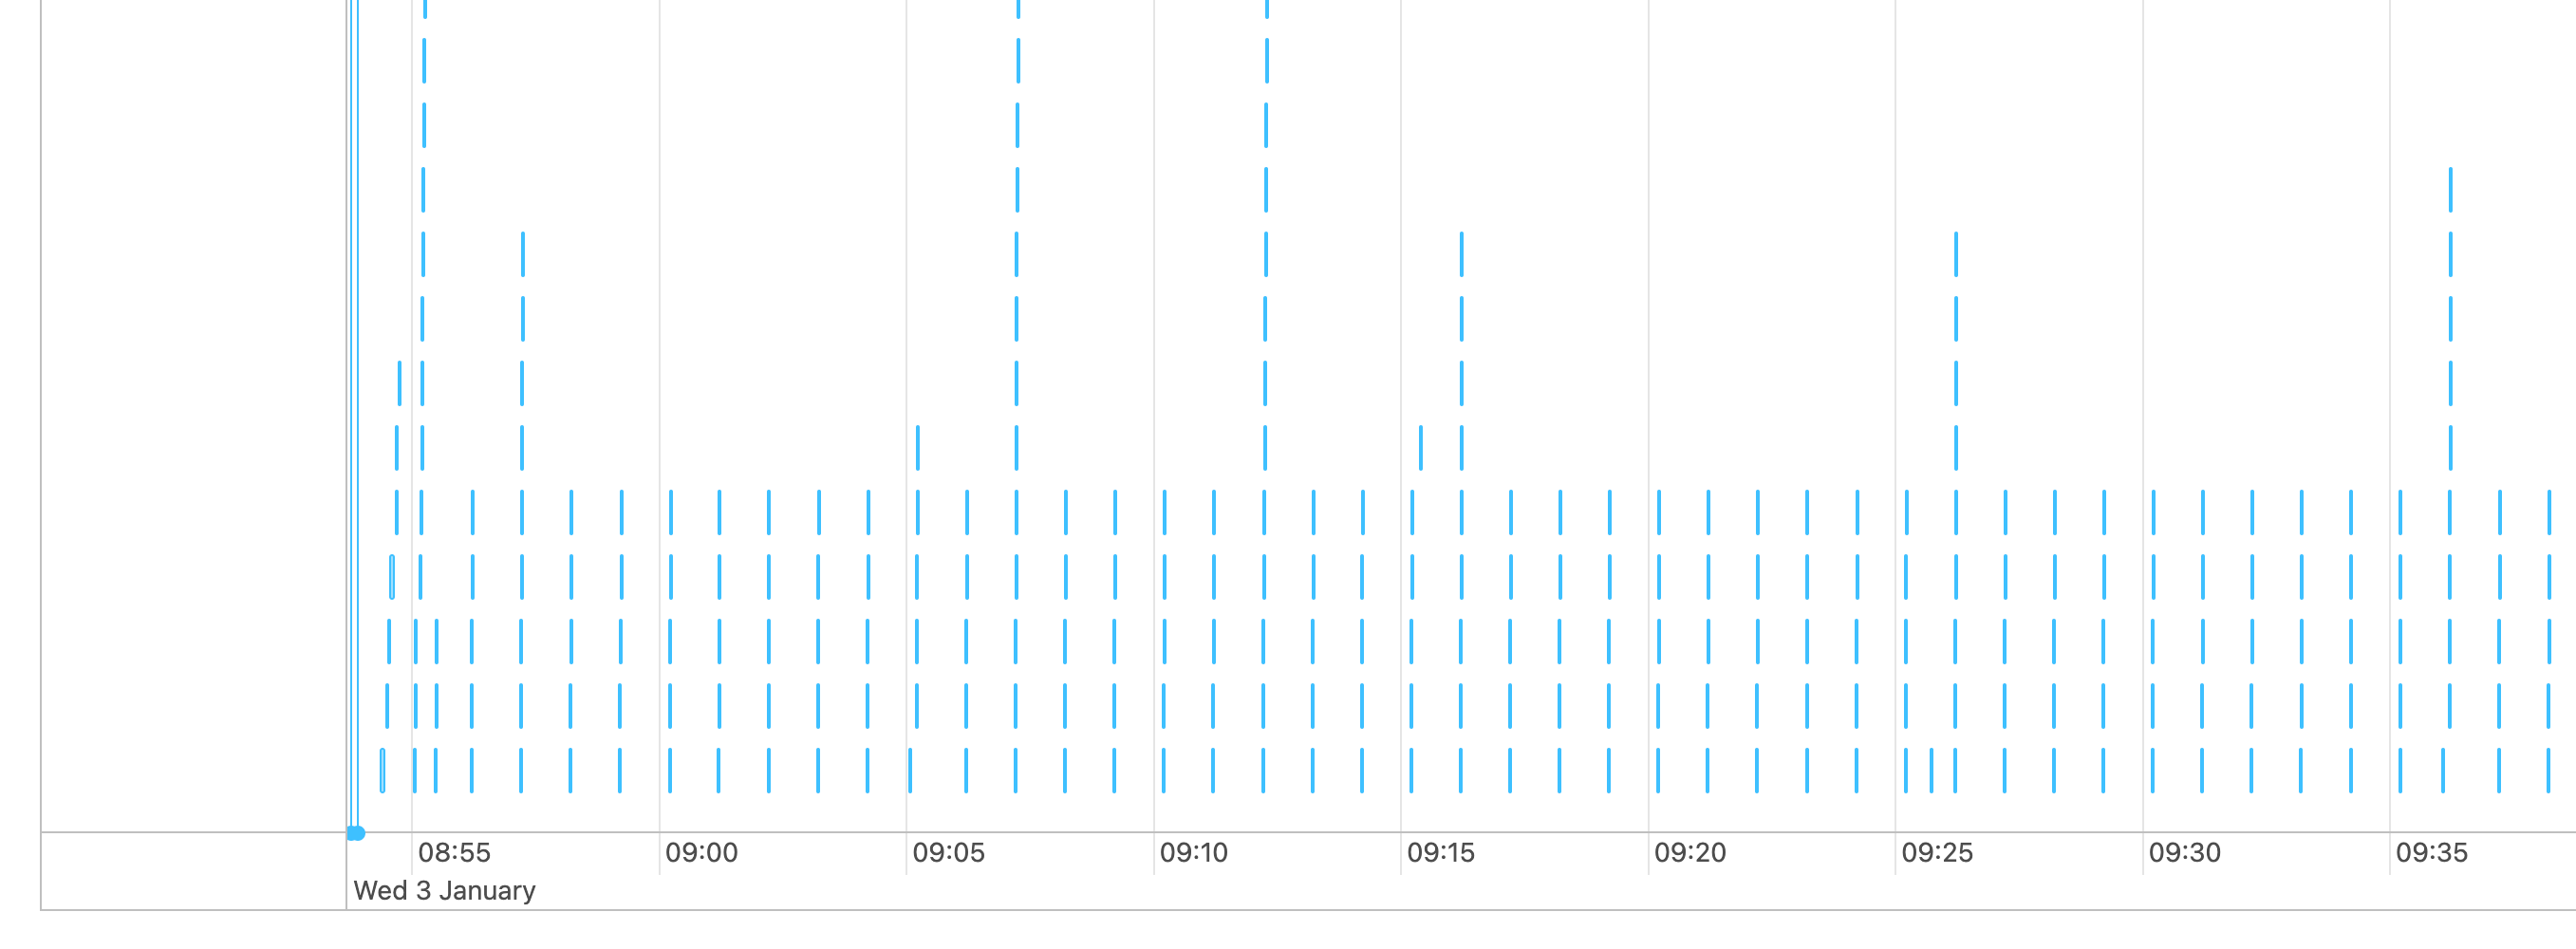
Notice all the tiny blue lines. Each of those is a small job that took a few seconds or less.
If your timeline is mostly small jobs, see Many small Spark jobs.
None of the above
If your timeline doesn't look like any of the above, the next step is to identify the longest job. Sort the jobs by duration and click on the link in the description for the longest job:
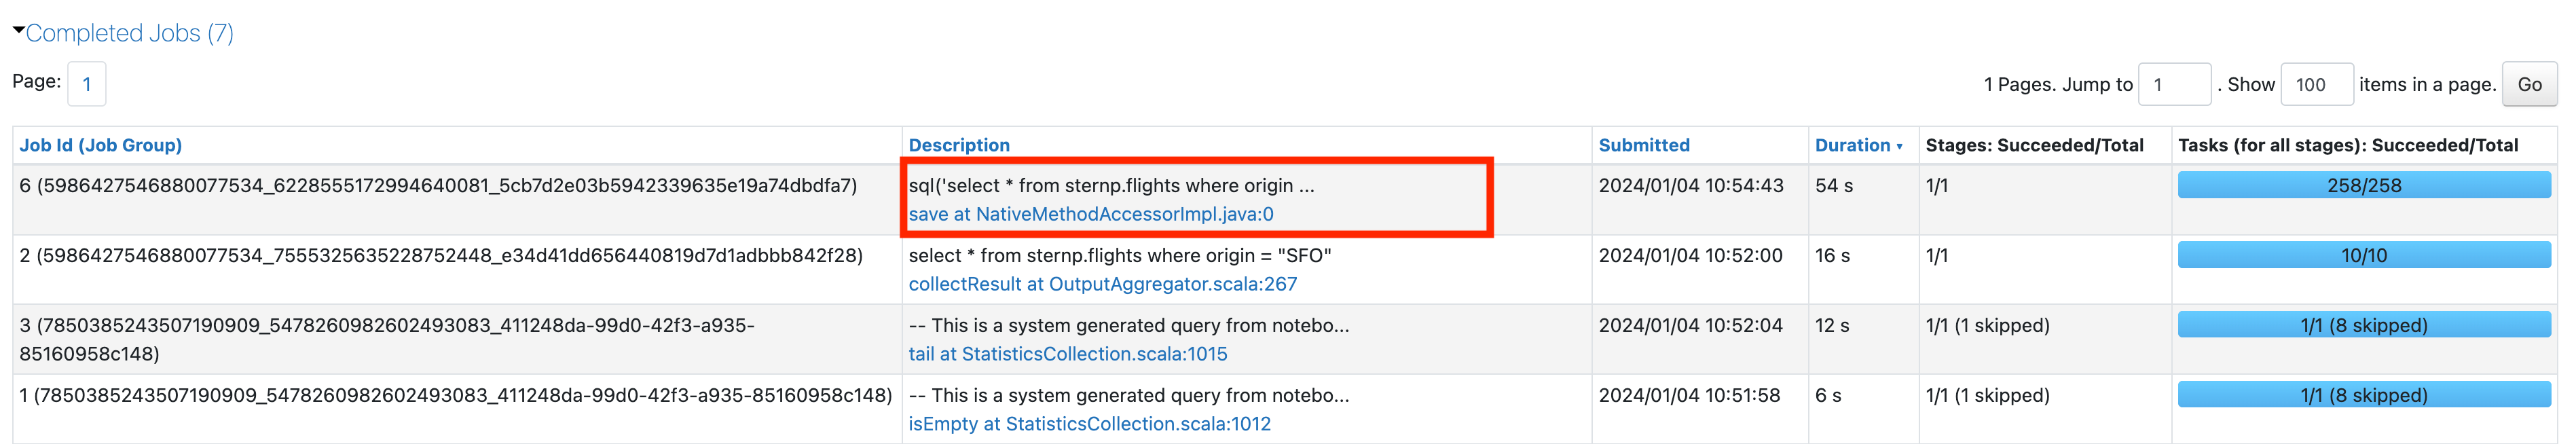
Once you're in the page for the longest job, additional information about investigating this long stage is in Diagnosing a long job in Spark.