Skew and spill
Skew and spill are two of the most common reasons a single stage runs much longer than expected. Both appear on the stage page, along with the fixes to try for each.
Use this page after you open the stage page for the longest stage in a job. To find that stage, see Diagnosing a long job in Spark. If the stage has only one task, see Long Spark stage with one task instead.
Spill
Spill happens when Spark runs low on execution memory, which Spark uses for shuffles, joins, sorts, and aggregations. Spark then writes data from memory to disk, which might be expensive. Spill is most common during data shuffling.
Check the stage for spill first. The stage details at the top of the stage page show spill statistics when the stage has spill:
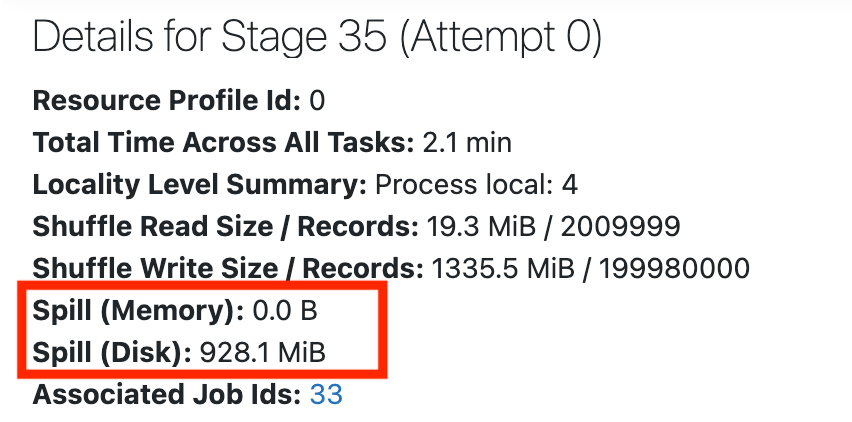
The stage details also include other metrics, such as Peak Execution Memory. For details about these and other stage metrics, see Stage detail in the Apache Spark documentation.
If no spill statistics appear, the stage has no spill. If the stage has some spill, try these approaches:
- Use auto-optimized shuffle. Set
spark.sql.shuffle.partitions=autoso that Spark picks the number of shuffle partitions based on the query plan and input data size. See AQE configuration. - Reduce the data held in memory. Reduce the number of rows or columns the query processes, or the size of large columns such as strings, arrays, maps, and structs. See DATA_SPILL.
- Increase executor memory. Total executor memory determines how much data fits in memory before Spark spills it to disk. Use instances with more memory. For complex batch ETL with joins across multiple tables, use fewer, larger workers to reduce the amount of data shuffled. See Complex batch ETL.
- Limit the streaming batch size. If the stage is part of a Structured Streaming query, limit the input rate so that large micro-batches don't cause spill. See Configure Structured Streaming batch size on Databricks.
Skew
Skew happens when one or a few tasks take much longer than the rest. The other cores sit idle while those tasks finish, which results in poor cluster utilization and longer jobs.
To check for skew, scroll down to Summary Metrics. Compare the Max duration to the 75th percentile duration. The following screenshot shows a healthy stage, where the 75th percentile and Max are the same:
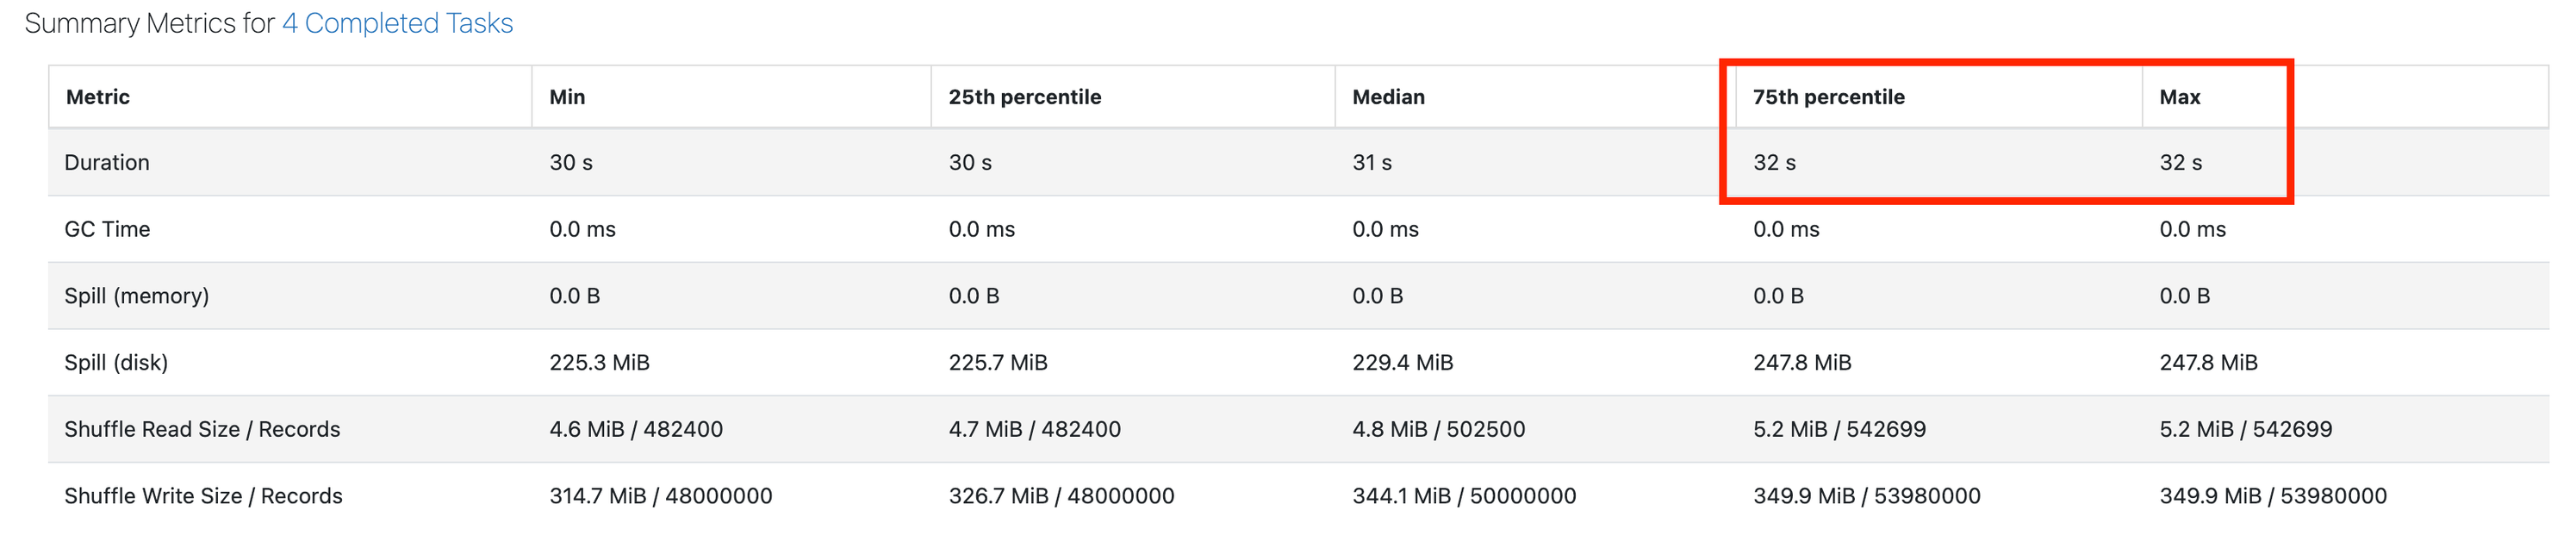
If the Max duration exceeds the 75th percentile by 50% or more, the stage might have skew. To fix skew, try these approaches:
- Check whether AQE handles the skew. If the skewed stage is part of a sort merge join or shuffle hash join, adaptive query execution (AQE) splits skewed partitions automatically, but only when a partition exceeds both of its size thresholds. Broadcast joins are never skew-optimized, and the join type determines which side AQE can optimize. See Why didn't AQE detect my data skew?.
- Adjust the AQE skew thresholds. If the skewed partitions are smaller than the thresholds, adjust
spark.sql.adaptive.skewJoin.skewedPartitionFactorandspark.sql.adaptive.skewJoin.skewedPartitionThresholdInBytes. See Dynamically handle skew join. - Salt skewed keys or pre-aggregate. If a few key values hold most of the data in a join or aggregation, append a random bucket suffix to the skewed keys, and then group and aggregate in two stages. See Handle data skew.
- Cluster the source table. If the skew comes from how a stored table is laid out, use liquid clustering, which is suited to tables with heavy data skew. See Use liquid clustering for tables.
- Rebalance output partitions. If the skewed stage writes a table, use the
REBALANCEhint. Spark splits skewed output partitions so that no partition is too large. Spark ignores the hint if AQE isn't enabled. See Partitioning hints.
No skew or spill
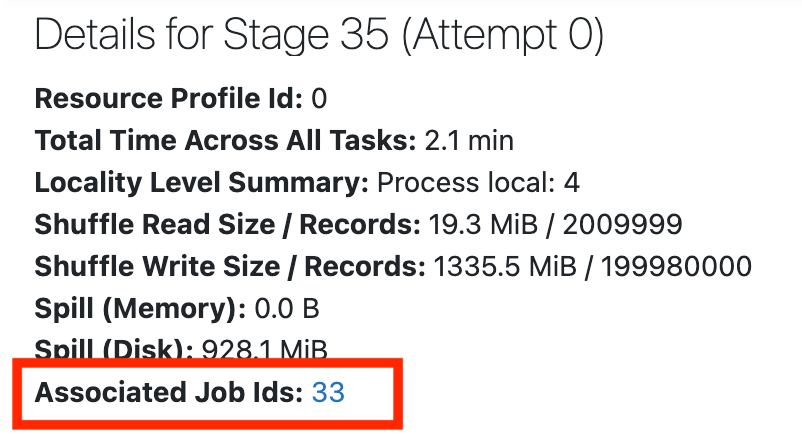
If the stage has no skew or spill, check whether it's I/O bound. To return to the job page, scroll to the top of the stage page and click Associated Job Ids:
Then see Spark stage high I/O.