Tutorial: Use sample dashboards
This tutorial shows you how to import and use sample dashboards from the samples gallery. These dashboards illustrate some of the rich visualizations you can use to gain insights from your data. No setup is required. These dashboards use data already available in your workspace and rely on a compute resource (called a SQL warehouse) already configured. You don't need to be an administrator to get started.
See Dashboards to learn about all of the visualization types and features available for dashboards.
Import a dashboard
-
In the sidebar, click
 Dashboards
If your workspace has any saved dashboards, they are listed.
-
Click View samples gallery.
-
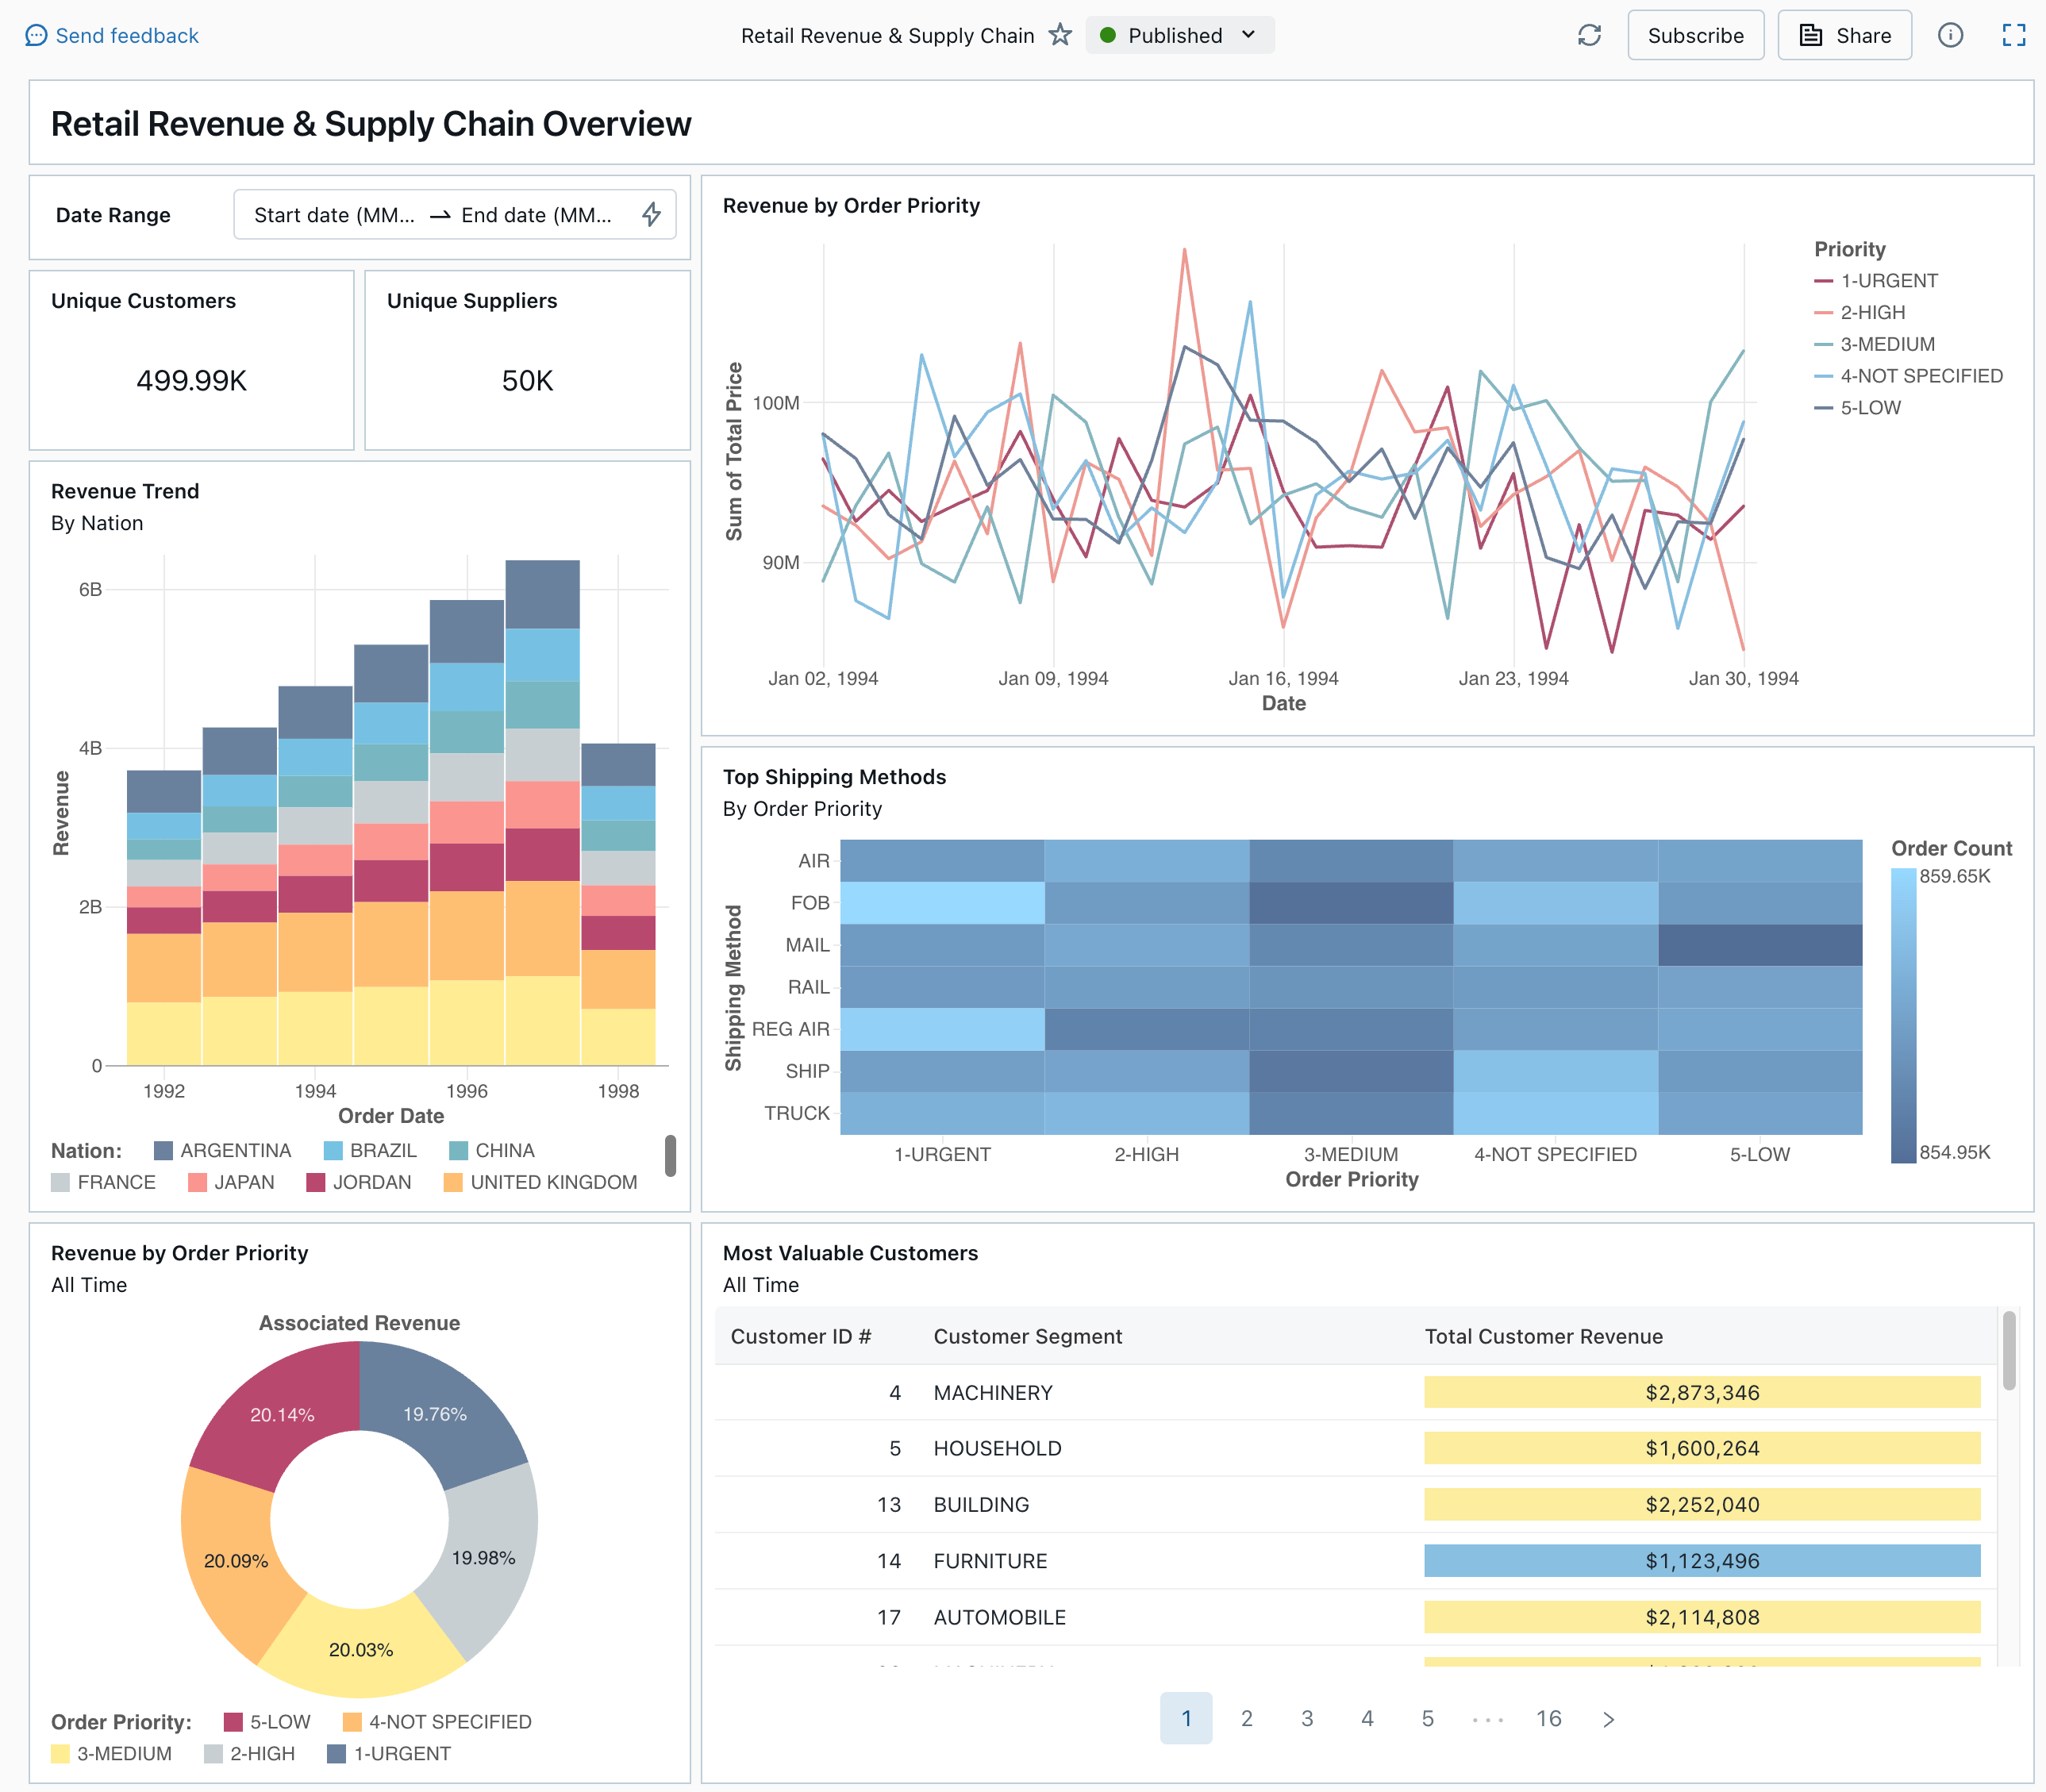
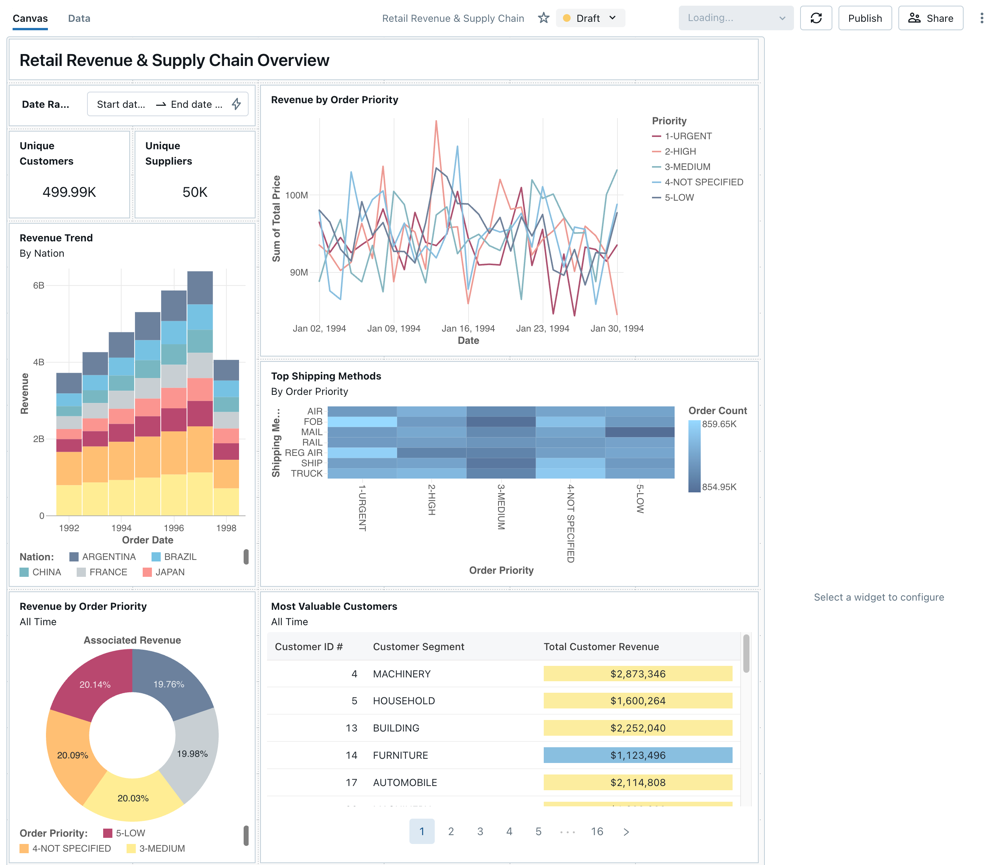
In the Retail Revenue & Supply Chain tile, click Import. The dashboard is imported into your workspace, and you are the owner.
The imported draft dashboard appears, and its visualizations are refreshed.
You can import a sample dashboard multiple times, and multiple users can each import it. You can also import the NYC Taxi Trip Analysis dashboard.
Explore a visualization's query
- Each visualization in a dashboard is the result of a query. You can access all queries in the Data tab on the draft dashboard. Click Data in the upper-left corner of the screen. Then, click the dataset you want to view to see the associated query.
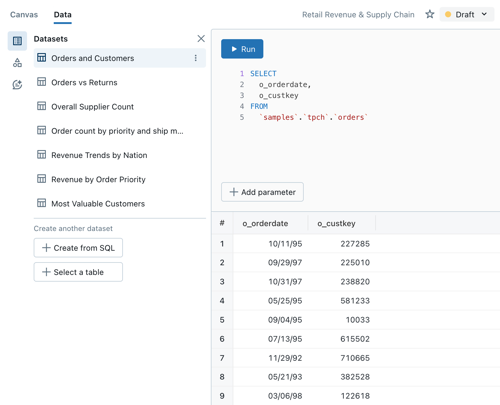
The SQL editor includes the query and results, which are shown in a table below the query.
The sample dashboards use data in the samples catalog, separate from data in your workspace. The samples catalog is available to every workspace but is read-only.
- Click the Untitled page tab to go back to the page that shows the dashboard's visualization widgets.
Interact with a visualization
- Hover over the Revenue by Order Priority visualization.
- Click each Priority in the legend to focus on that group of data and hide the other lines.
- Right-click on the visualization to see its context menu. You can delete or clone a visualization. You can also download the associated dataset as a CSV, TSV, or Excel file. Click Go to Revenue by Order Priority to view the associated query.
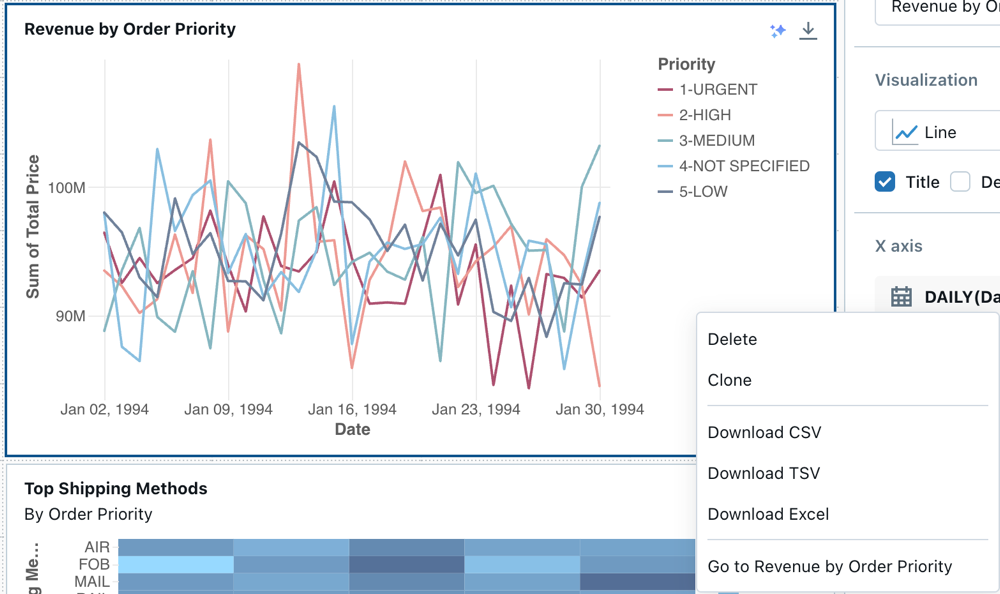
The query opens on the Data tab of your dashboard.
Publish the dashboard
- Click Publish at the top of the page. A Publish dialog appears.
- Click Publish in the dialog to create a sharable, non-editable version of your dashboard. This dashboard is published with your credentials embedded by default. This means that other viewers use your credentials to access the data and compute to generate visualizations on your dashboard. See Publish a dashboard.
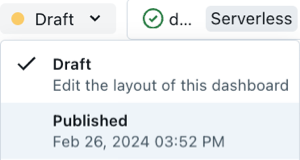
- Use the switcher at the top of the page to view your published dashboard.
Share the dashboard
To share a dashboard with colleagues in your workspace:
-
Click Share at the top of the page.
-
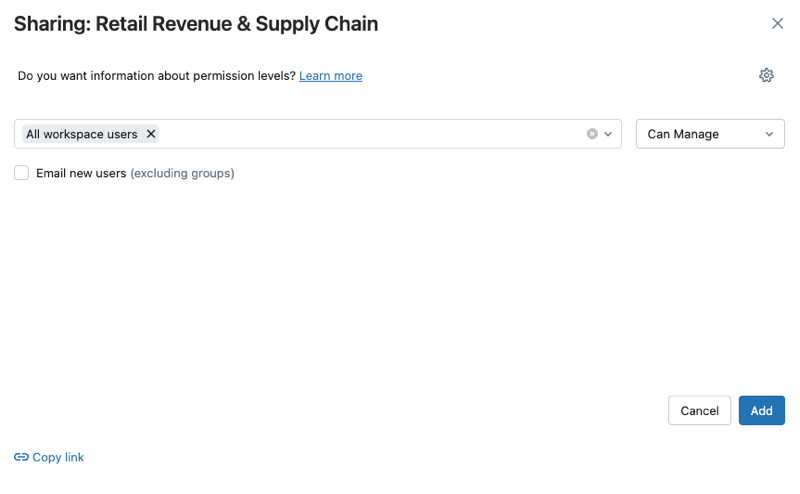
Select a user or group in your workspace.
To share the dashboard with all users in the workspace, select All workspace users. Then, click Add.
-
Select the permission to grant.
To share a dashboard with account users:
-
Under Sharing settings at the bottom of the sharing dialog, click Anyone in my account can view.
This means that anyone who is registered to your Databricks account can use a link to access your dashboard. If you have embedded your credentials, account-level users don't need workspace access to view your dashboard.
-
Close the form.
Schedule automatic dashboard refreshes
You can schedule the dashboard to refresh at an interval automatically.
-
At the top of the page, click Schedule.
-
Click Add schedule.
-
Select an interval, such as Every 1 hour at 5 minutes past the hour. The SQL warehouse that you selected to run your queries is used to run the dashboard's queries and generate visualizations when the dashboard is refreshed.
Workspace admin users can create, configure, and delete SQL warehouses.
-
Click Create.
The dialog shows all schedules associated with the dashboard.
-
Optionally, click Subscribe to add yourself as a subscriber and receive an email with a PDF snapshot of the dashboard after a scheduled run completes.
You can use the kebab menu
 to edit the schedule and add more subscribers. See Manage scheduled dashboard updates and subscriptions.
 -
To delete an existing schedule for a dashboard:
- Click Subscribe.
- Click the kebab menu on the right.
- Click Delete.