Develop and debug ETL pipelines with the Lakeflow Pipelines Editor
This feature is in Public Preview.
This article describes using the Lakeflow Pipelines Editor to develop and debug ETL (extract, transform, and load) pipelines in Lakeflow Spark Declarative Pipelines (SDP).
The Lakeflow Pipelines Editor is enabled by default. You can turn it off, or re-enable it if it has been turned off. See Enable the Lakeflow Pipelines Editor and updated monitoring.
What is the Lakeflow Pipelines Editor?
The Lakeflow Pipelines Editor is an IDE built for developing pipelines. It combines all pipeline development tasks on a single surface, supporting code-first workflows, folder-based code organization, selective execution, data previews, and pipeline graphs. Integrated with the Databricks platform, it also enables version control, code reviews, and scheduled runs.
Overview of the Lakeflow Pipelines Editor UI
The following image shows the Lakeflow Pipelines Editor:
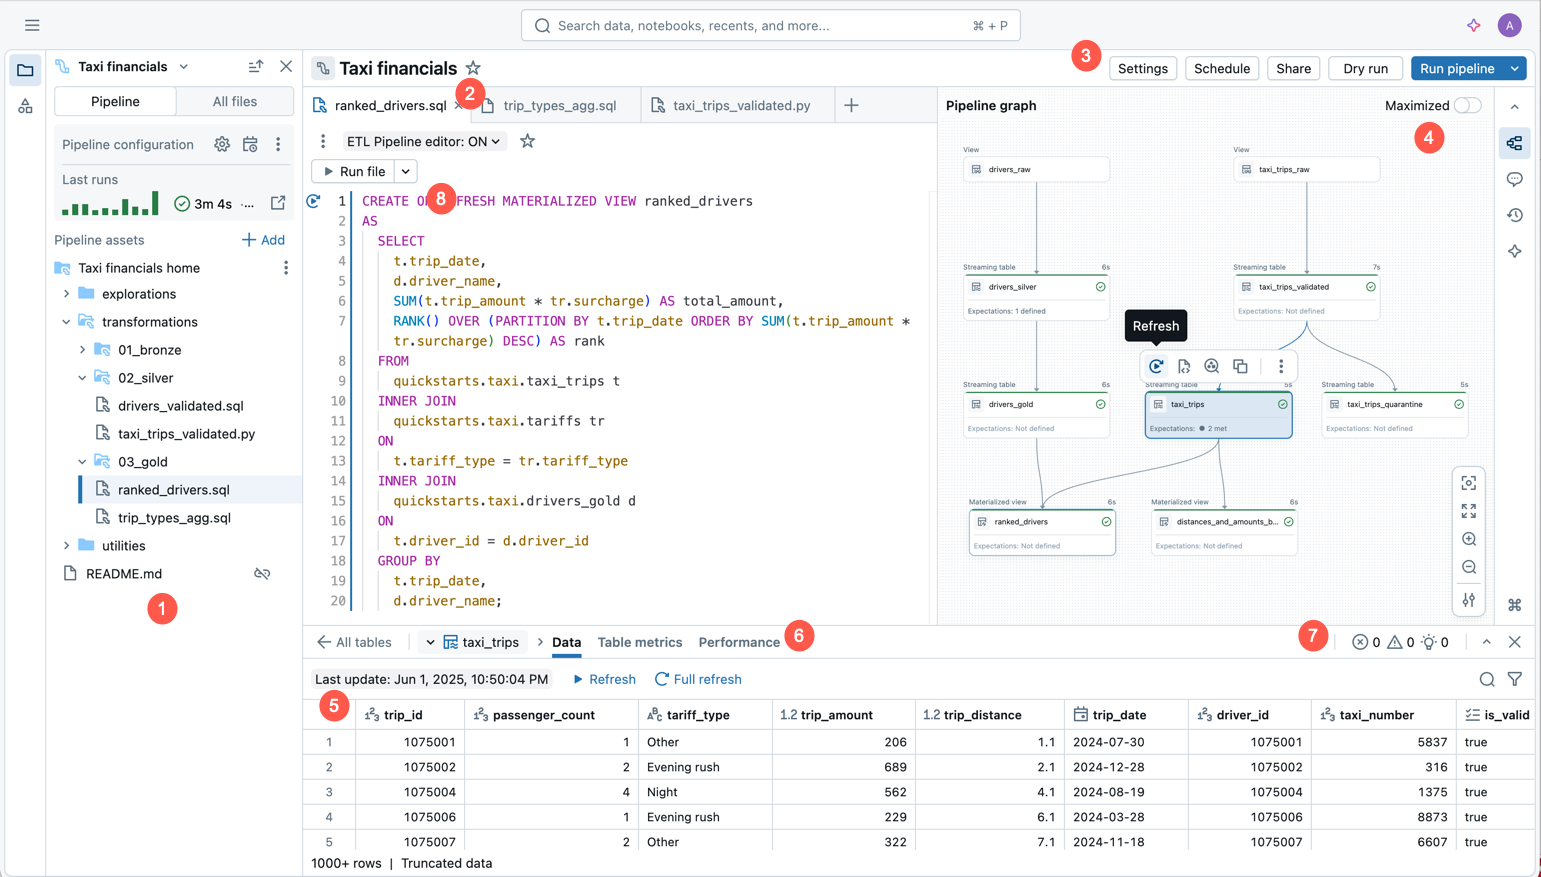
The image shows the following features:
- Pipeline asset browser: Create, delete, rename, and organize pipeline assets. Also includes shortcuts to pipeline configuration.
- Multi-file code editor with tabs: Work across multiple code files associated with a pipeline.
- Pipeline-specific toolbar: Includes pipeline configuration options and has pipeline-level run actions.
- Interactive directed acyclical graph (DAG): Get an overview of your tables, open the data previews bottom bar, and perform other table-related actions.
- Data preview: Inspect the data of your streaming tables and materialized views.
- Table-level execution insights: Get execution insights for all tables or a single table in a pipeline. The insights refer to the latest pipeline run.
- Issues panel: This feature summarizes errors across all files in the pipeline, and you can navigate to where the error occurred inside a specific file. It complements code-affixed error indicators.
- Selective execution: The code editor has features for step-by-step development, such as the ability to refresh tables only in the current file using the Run file action or a single table.
- Default pipeline folder structure: New pipelines include a predefined folder structure and sample code that you can use as a starting point for your pipeline.
- Simplified pipeline creation: Provide a name, catalog, and schema where tables should be created by default, and a pipeline is created using default settings. You can later adjust Settings from the pipeline editor toolbar.
Create a new ETL pipeline
To create a new ETL pipeline using the Lakeflow Pipelines Editor, follow these steps:
-
At the top of the sidebar, click
 New and then select
  ETL pipeline.
 -
At the top, you can give your pipeline a unique name.
-
Just under the name, you can see the default catalog and schema that have been chosen for you. Change these to give your pipeline different defaults.
The default catalog and the default schema are where datasets are read from or written to when you do not qualify datasets with a catalog or schema in your code. See Database objects in Databricks for more information.
-
Select your preferred option to create a pipeline, by choosing one of the following options:
- Start with sample code in SQL to create a new pipeline and folder structure, including sample code in SQL.
- Start with sample code in Python to create a new pipeline and folder structure, including sample code in Python.
- Start with a single transformation to create a new pipeline and folder structure, with a new blank code file.
- Add existing assets to create a pipeline that you can associate with exisitng code files in your workspace.
You can have both SQL and Python source code files in your ETL pipeline. When creating a new pipeline and choosing a language for the sample code, the language is only for the sample code included in your pipeline by default.
-
When you make your selection, you are redirected to the newly created pipeline.
The ETL pipeline is created with the following default settings:
- Unity Catalog
- Current channel
- Serverless compute
- Development mode off. This setting only affects scheduled runs of the pipeline. Running the pipeline from the editor always defaults to using development mode.
You can adjust these settings from the pipeline toolbar.
Alternatively, you can create an ETL pipeline from the workspace browser:
- Click Workspace in the left side panel.
- Select any folder, including Git folders.
- Click Create in the upper-right corner, and click ETL pipeline.
You can also create an ETL pipeline from the jobs and pipelines page:
- In your workspace, click
 Jobs & Pipelines in the sidebar.
 - Under New, click ETL Pipeline.
The Databricks CLI provides commands to create, modify, and manage your Lakeflow Spark Declarative Pipelines pipelines from a terminal. See pipelines command group.
Open an existing ETL pipeline
There are multiple ways to open an existing ETL pipeline in the Lakeflow Pipelines Editor:
-
Open any source file associated with the pipeline:
- Click Workspace in the side panel.
- Navigate to a folder with source code files for your pipeline.
- Click the source code file to open the pipeline in the editor.
-
Open a recently edited pipeline:
- From the editor, you can navigate to other pipelines you have recently edited by clicking the name of the pipeline at the top of the asset browser and choosing another pipeline from the recents list that appears.
- From outside the editor, from the Recents page on the left sidebar, open a pipeline or a file configured as the source code for a pipeline.
-
When viewing a pipeline across the product, you can choose to edit the pipeline:
- In the pipeline monitoring page, click
 Edit pipeline.
 - On the Job Runs page in the left sidebar, click Jobs & pipelines tab and click
 and Edit pipeline.
 - When you edit a job and add a pipeline task, you can click the
 button when you choose a pipeline under Pipeline.
- In the pipeline monitoring page, click
-
If you are browsing All files in the asset browser, and open a source code file from another pipeline, a banner is shown at the top of the editor, prompting you to open that associated pipeline.
Pipeline assets browser
When you are editing a pipeline, the left workspace sidebar uses a special mode called the pipeline assets browser. By default, the pipeline assets browser focuses on the pipeline root, and folders and files within the root. You can also choose to view All files to see files outside the root of the pipeline. The tabs opened in the pipeline editor while editing a specific pipeline are remembered, and when you switch to another pipeline, the tabs open the last time you edited that pipeline are restored.
The editor also has contexts for editing SQL files (called the Databricks SQL Editor) and a general context for editing workspace files that are not SQL files or pipeline files. Each of these contexts remembers and restores the tabs that you had open the last time that you used that context. You can switch context from the top of the left sidebar. Click the header to choose between Workspace, SQL Editor, or recently edited pipelines.
When you open a file from the Workspace browser page, it opens in the corresponding editor for that file. If the file is associated with a pipeline, that is the Lakeflow Pipelines Editor.
To open a file that isn't part of the pipeline, but retain the pipeline context, open the file from the asset browser's All files tab.
The pipeline asset browser has two tabs:
- Pipeline: This is where you can find all files associated with the pipeline. You can create, delete, rename, and organize them into folders. This tab also includes shortcuts for pipeline configuration, and a graphical view of recent runs.
- All files: All other workspace assets are available here. This can be useful for finding files to add to the pipeline, or viewing other files related to the pipeline, such as a YAML file that defines a Databricks Asset Bundles.
You can have the following types of files in your pipeline:
- Source code files: These files are part of the pipeline's source code definition, which can be seen in Settings. Databricks recommends always storing source code files inside the pipeline root folder; otherwise, they are shown in an external file section at the bottom of the browser and have a less rich feature set.
- Non-source code files: These files are stored inside the pipeline root folder but are not part of the pipeline source code definition.
You must use the pipeline assets browser under the Pipeline tab to manage files and folders for your pipeline. This updates the pipeline settings correctly. Moving or renaming files and folders from your workspace browser or the All files tab breaks the pipeline configuration, and you must then resolve this manually in Settings.
Root folder
The pipeline assets browser is anchored in a pipeline root folder. When you create a new pipeline, the pipeline root folder is created in your user home folder and is named the same as the pipeline name.
You can change the root folder in the pipeline assets browser. This is useful if you created a pipeline in a folder and later want to move everything to a different folder. For example, you created the pipeline in a normal folder and want to move the source code to a Git folder for version control.
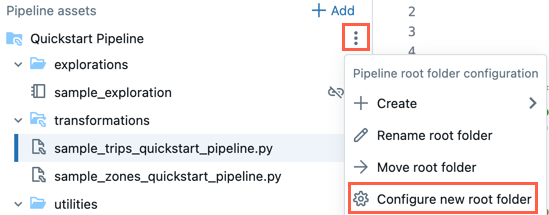
- Click the overflow menu for the root folder.
- Click Configure new root folder.
- Under Pipeline root folder click
 and choose another folder as the pipeline root folder.
 - Click Save.
In the ![]() for the root folder, you can also click Rename root folder to rename the folder name. Here, you can also click Move root folder to move the root folder, for example, into a Git folder.
for the root folder, you can also click Rename root folder to rename the folder name. Here, you can also click Move root folder to move the root folder, for example, into a Git folder.
You can also change the pipeline root folder in settings:
- Click Settings.
- Under Code assets click Configure paths.
- Click to change the folder under Pipeline root folder.
- Click Save.
If you change the pipeline root folder, the file list displayed by the pipeline assets browser is affected, as the files in the previous root folder are shown as external files.
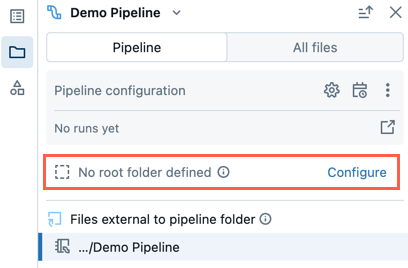
Existing pipeline with no root folder
An existing pipeline created using the legacy notebook editing experience won't have a root folder configured. When you open a pipeline that doesn't have a root folder configured, you will be prompted to create a root folder and organize source files within it.
You can dismiss that, and continue editing the pipeline without setting a root folder.
If you later wish to configure the root folder for your pipeline, follow these steps:
- In the pipeline assets browser, click Configure.
- Click to select the root folder under Pipeline root folder.
- Click Save.
Default folder structure
When you create a new pipeline, a default folder structure is created. This is the recommended structure for organizing your pipeline source and non-source code files, as described below.
A small number of sample code files are created in this folder structure.
Folder name | Recommended location for these types of files |
|---|---|
| Root folder that contains all folders and files for your pipeline. |
| Source code files, such as Python or SQL code files with table definitions. |
| Non-source code files, such as notebooks, queries, and code files used for explorative data analysis. |
| Non-source code files with Python modules that can be imported from other code files. If you choose SQL as your language for sample code, this folder is not created. |
You can rename the folder names or change the structure to fit your workflow. To add a new source code folder, follow these steps:
- Click Add in the pipeline assets browser.
- Click Create pipeline source code folder.
- Enter a folder name and click Create.
Source code files
Source code files are part of the pipeline's source code definition. When you run the pipeline, these files are evaluated. Files and folders part of the source code definition have a special icon with a mini Pipeline icon superimposed.
To add a new source code file, follow these steps:
- Click Add in the pipeline assets browser.
- Click Transformation.
- Enter a Name for the file and select Python or SQL as the Language.
- Click Create.
You can also click ![]() for any folder in the pipeline assets browser to add a source code file.
for any folder in the pipeline assets browser to add a source code file.
A transformations folder for source code is created by default when you create a new pipeline. This folder is the recommended location for pipeline source code, such as Python or SQL code files with pipeline table definitions.
Non-source code files
Non-source code files are stored inside the pipeline root folder but are not part of the pipeline source code definition. These files are not evaluated when you run the pipeline. Non-source code files cannot be external files.
You can use this for files related to your work on the pipeline that you'd like to store together with the source code. For example:
- Notebooks that you use for ad hoc explorations executed on non-Lakeflow Spark Declarative Pipelines compute outside the lifecycle of a pipeline.
- Python modules that are not to be evaluated with your source code unless you explicitly import these modules inside your source code files.
To add a new non-source code file, follow these steps:
- Click Add in the pipeline assets browser.
- Click Exploration or Utility.
- Enter a Name for the file.
- Click Create.
You can also click ![]() for the pipeline root folder or a non-source code file to add non-source code files to the folder.
for the pipeline root folder or a non-source code file to add non-source code files to the folder.
When you create a new pipeline, the following folders for non-source code files are created by default:
Folder name | Description |
|---|---|
| This folder is the recommended location for notebooks, queries, dashboards, and other files and then run them on non-Lakeflow Spark Declarative Pipelines compute, as you would normally do outside of a pipeline's execution lifecycle. |
| This folder is the recommended location for Python modules that can be imported from other files via direct imports expressed as |
You can also import Python modules located outside the root folder, but in that case, you must append the folder path to sys.path in your Python code:
import sys, os
sys.path.append(os.path.abspath('<alternate_path_for_utilities>/utilities'))
from utils import \*
External files
The pipeline browser's External files section shows source code files outside the root folder.
To move an external file to the root folder, such as the transformations folder, follow these steps:
- Click for the file in the assets browser and click Move.
- Choose the folder to which you want to move the file and click Move.
Files associated with multiple pipelines
A badge is shown in the file's header if a file is associated with more than one pipeline. It has a count of associated pipelines and allows switching to the other ones.
All files section
In addition to the Pipeline section, there is an All files section, where you can open any file in your workspace. Here you can:
- Open files outside the root folder in a tab without leaving the Lakeflow Pipelines Editor.
- Navigate to another pipeline's source code files and open them. This opens the file in the editor, and give you a banner with the option to switch focus in the editor to this second pipeline.
- Move files to the pipeline's root folder.
- Include files outside the root folder in the pipeline source code definition.
Edit pipeline source files
When you open a pipeline source file from the workspace browser, or the pipeline assets browser, it opens in an editor tab in the Lakeflow Pipelines Editor. Opening more files opens separate tabs, allowing you to edit multiple files at once.
Opening a file that isn't associated with a pipeline from the workspace browser will open the editor in a different context (either the general Workspace editor or, for SQL files, the SQL Editor).
When you open a non-pipeline file from the All files tab of the pipeline asset browser, it opens in a new tab in the pipeline context.
Pipeline source code includes multiple files. By default the source files are in the transformations folder in the pipeline assets browser. Source code files can be Python (*.py) or SQL (*.sql) files. Your source can include a mix of both Python and SQL files in a single pipeline, and the code in one file can reference a table or view defined in another file.
You can also include markdown (*.md) files in your tranformations folder. Markdown files can be used for documentation or notes, but are ignored when running a pipeline update.
The following features are specific to the Lakeflow Pipelines Editor:
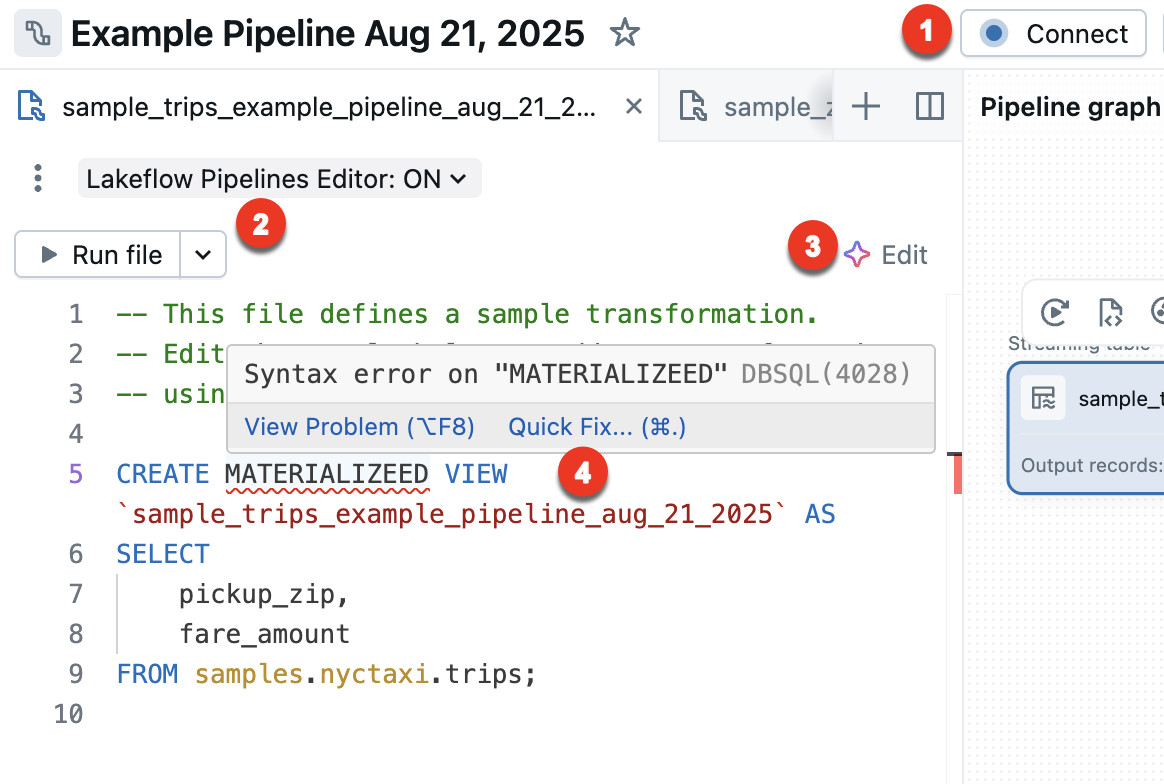
-
Connect - Connect to either serverless or classic compute to run the pipeline. All files associated with the pipeline use the same compute connection, so once you have connected, you don't need to connect for other files in the same pipeline. For more information about compute options, see Compute configuration options.
For non-pipeline files, such as an exploratory notebook, the connect option is available, but applies only to that individual file.
-
Run file - Run the code to update the tables defined in this source file. The next section describes different ways to run your pipeline code.
-
Edit - Use the Databricks Assistant to edit or add code in the file.
-
Quick fix - When there is an error in your code, use the Assistant to fix the error.
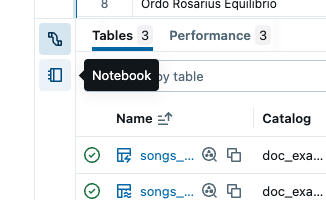
The bottom panel also adjusts, based on the current tab. Viewing pipeline information in the bottom panel is always available. Non-pipeline associated files, such as SQL editor files, also show their output in the bottom panel in a separate tab. The following image shows a vertical tab selector to switch the bottom panel between viewing pipeline information or information for the selected notebook.
Run pipeline code
You have four options to run your pipeline code:
-
Run all source code files in the pipeline
Click Run pipeline or Run pipeline with full table refresh to run all table definitions in all files defined as pipeline source code. For details on refresh types, see Pipeline refresh semantics.

You can also click Dry run to validate the pipeline without updating any data.
-
Run the code in a single file
Click Run file or Run file with full table refresh to run all table definitions in the current file. Other files in the pipeline are not evaluated.

This option is useful for debugging when quickly editing and iterating on a file. There are side effects when only running the code in a single file.
- When other files are not evaluated, errors in those files are not found.
- Tables materialized in other files use the most recent materialization of the table, even if there is more recent source data.
- You could run into errors if a referenced table has not yet been materialized.
- The DAG may be incorrect or disjointed for tables in other files that have not been materialized. Databricks does a best effort to keep the graph correct, but does not evaluate other files to do so.
When you are finished debugging and editing a file, Databricks recommends running all source code files in the pipeline to verify that the pipeline works end-to-end before putting the pipeline in production.
-
Run the code for a single table
Next to the definition of a table in the source code file, click the Run table icon
 and then choose either Refresh table or Full refresh table from the drop-down. Running the code for a single table has similar side-effects as running the code in a single file.
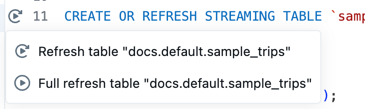 note
noteRunning the code for a single table is available for streaming tables and materialized views. Sinks and views are not supported.
-
Run the code for a set of tables
You can select tables from the DAG to create a list of tables to run. Hover over the table in the DAG, click the
, and choose Select table for refresh. After you have chosen the tables to refresh, choose either the Run or Run with full refresh option from the bottom of the DAG.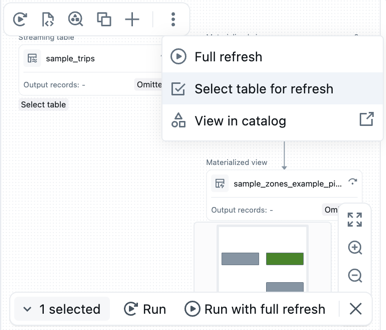
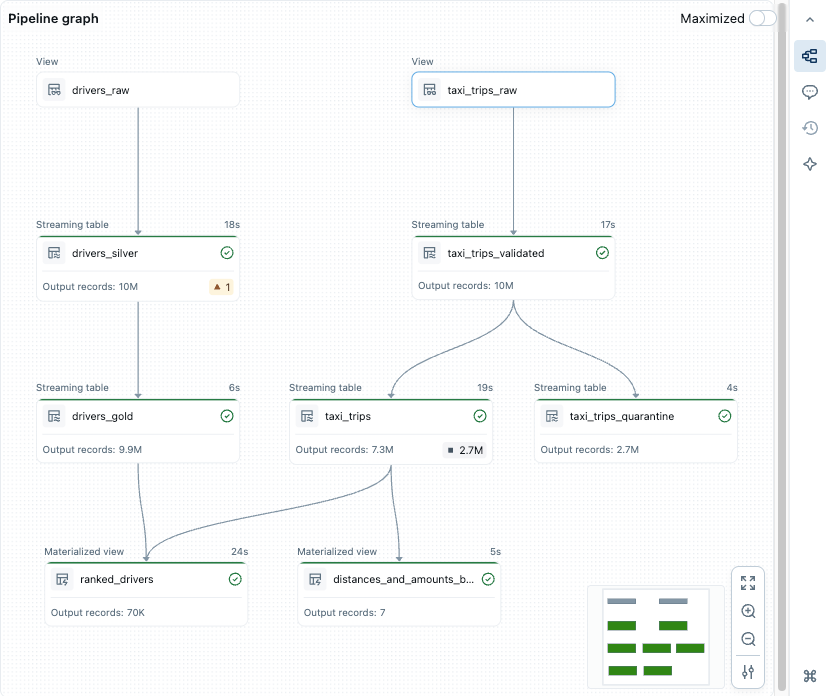
Pipeline graph, directed acyclical graph (DAG)
After you have run or validated all source code files in the pipeline, you see a directed acyclic graph (DAG), called the pipeline graph. The graph shows the table dependency graph. Each node has different states along the pipeline lifecycle, such as validated, running, or error.
You can toggle the graph on and off by clicking the graph icon in the right side panel. You can also maximize the graph. There are additional options at the bottom right, including zoom options, and ![]() More options to display the graph in a vertical or horizontal layout.
More options to display the graph in a vertical or horizontal layout.
Hovering over a node displays a toolbar with options, including refresh the query. Right-clicking a node gives you the same options, in a context-menu.
Clicking a node shows the data preview and table definition. When you edit a file, the tables defined in that file are highlighted in the graph.
Data previews
The data preview section shows sample data for a selected table.
You see a preview of the table's data when you click a node in the directed acyclic graph (DAG).
If no table has been selected, go to the Tables section and click View data preview ![]() . If you have chosen a table, click All tables to return to all tables.
. If you have chosen a table, click All tables to return to all tables.
When you preview the table data, you can filter or sort the data in-place. If you want to do more complex analysis, you can use or create a notebook in the Explorations folder (assuming that you kept the default folder structure). By default, source code in this folder is not run during a pipeline update, so you can create queries without affecting the pipeline output.
Execution insights
You can see the table execution insights about the latest pipeline update in the panels at the editor's bottom.
Panel | Description |
|---|---|
Tables | Lists all tables with their statuses and metrics. If you select one table, you see the metrics and performance for that table and a tab for the data preview. |
Performance | Query history and profiles for all flows in this pipeline. You can access execution metrics and detailed query plans during and after execution. See Access query history for pipelines for more information. |
Issues panel | Click the panel for a simplified view of errors and warnings for the pipeline. You can click an entry to see more details, and then navigate to the place in the code where the error occurred. If the error is in a file other than the one currently displayed, this redirects you to the file where the error is. Click View details to see the corresponding event log entry for complete details. Click View logs to see the complete event log. Code-affixed error indicators are shown for errors associated with a specific part of the code. To get more details, click the error icon or hover over the red line. A pop-up with more information appears. You can then click Quick fix to reveal a set of actions to troubleshoot the error. |
Event log | All events triggered during the last pipeline run. Click View logs or any entry in the issues tray. |
Pipeline configuration
You can configure your pipeline from the pipeline editor. You can make changes to the pipeline settings, schedule, or permissions.
Each of these can be accessed from a button in the header of the editor, or from icons on the asset browser (the left sidebar).
-
Settings (or choose
 in the asset browser):
You can edit settings for the pipeline from the settings panel, including general information, root folder and source code configuration, compute configuration, notifications, advanced settings, and more.
-
Schedule (or choose
 in the asset browser):
You can create one or more schedules for your pipeline from the schedule dialog. For example, if you want to run it daily, you can set that here. It creates a job to run the pipeline on the schedule you choose. You can add a new schedule or remove an existing schedule from the schedule dialog.
-
Share (or, from the
menu in the asset browser, choose  ):
):You can manage permissions on the pipeline for users and groups from the pipeline permissions dialog.
Event Log
You can publish the event log for a pipeline to Unity Catalog. By default, the event log for your pipeline is shown in the UI, and accessible for querying by the owner.
- Open Settings.
- Click the
 arrow next to Advanced settings.
 - Click Edit advanced settings.
- Under Event logs, click Publish to catalog.
- Provide a name, catalog, and schema for the event log.
- Click Save.
Your pipeline events are published to the table you specified.
To learn more about using the pipeline event log, see Query the event log.
Pipeline environment
You can create an environment for your source code by adding dependencies in Settings.
- Open Settings.
- Under Environment, click Edit environment.
- Select Add dependency to add a dependency, as if you were adding it to a
requirements.txtfile. For more information about dependencies, see Add dependencies to the notebook.
Databricks recommends that you pin the version with ==. See PyPI package.
The environment applies to all source code files in your pipeline.
Notifications
You can add notifications using the Pipeline settings.
- Open Settings.
- In the Notifications section, click Add notification.
- Add one or more email addresses and the events you want them to be sent.
- Click Add notification.
Create custom responses to events, including notifications or custom handling, by using Python event hooks.
Monitoring pipelines
Databricks also provides features to monitor running pipelines. The editor shows the results and execution insights about the most recent run. It is optimized to help you to iterate efficiently while you develop your pipeline interactively.
The pipeline monitoring page allows you to view historical runs, which is useful when a pipeline is running on a schedule using a Job.
There is a default monitoring experience, and an updated preview monitoring experience. The following section describes how to enable or disable the preview monitoring experience. For information about both experiences, see Monitor pipelines in the UI.
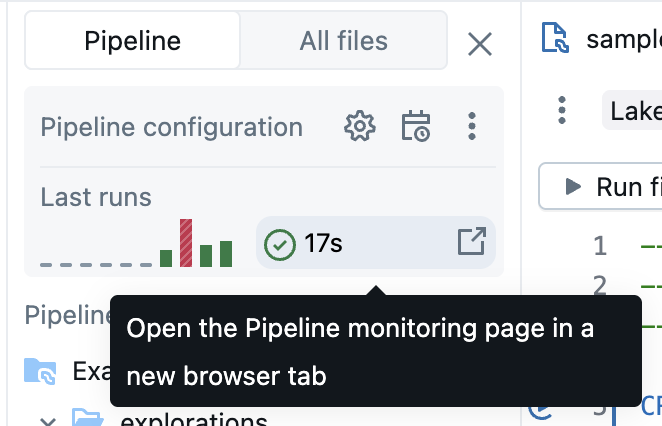
The monitoring experience is available from the Jobs & Pipelines button on the left side of your workspace. You can also jump directly to the monitoring page from the editor by clicking the run results in the pipeline assets browser.
For more information about the monitoring page, see Monitor pipelines in the UI. The monitoring UI includes the ability to return to the Lakeflow Pipelines Editor by selecting Edit pipeline from the header of the UI.
Enable the Lakeflow Pipelines Editor and updated monitoring
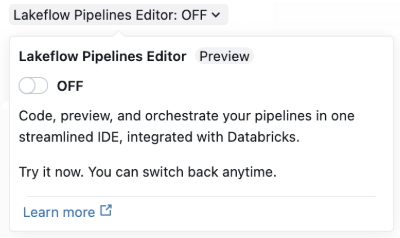
The Lakeflow Pipelines Editor preview is enabled by default. You can disable it, or re-enable it with the following instructions. When the Lakeflow Pipelines Editor preview is enabled, you can also enable the updated monitoring experience (preview).
The preview must be enabled by setting the Lakeflow Pipelines Editor option for your workspace. See Manage Databricks previews for more information on how to edit options.
Once the preview is enabled, you can enable the Lakeflow Pipelines Editor in multiple ways:
-
When you create a new ETL pipeline, enable the editor in Lakeflow Spark Declarative Pipelines with the Lakeflow Pipelines Editor toggle.
The advanced settings page for the pipeline is used the first time you enable the editor. The simplified pipeline creation window is used the next time you create a new pipeline.
-
For an existing pipeline, open a notebook used in a pipeline and enable the Lakeflow Pipelines Editor toggle in the header. You can also go to the pipeline monitoring page and click Settings to enable the Lakeflow Pipelines Editor.
-
You can enable the Lakeflow Pipelines Editor from user settings:
- Click your user badge in the upper-right area of your workspace and then click Settings and Developer.
- Enable Lakeflow Pipelines Editor.
After you have enabled the Lakeflow Pipelines Editor toggle, all ETL pipelines use the Lakeflow Pipelines Editor by default. You can turn the Lakeflow Pipelines Editor on and off from the editor.
If you disable the new pipeline editor, it is helpful to leave feedback describing why you have turned it off. There is a Send feedback button on the toggle for any feedback you have on the new editor.
Enable the new pipeline monitoring page
This feature is in Public Preview.
As part of the Lakeflow Pipelines Editor preview, you can also enable a new pipeline monitoring page for a pipeline. The Lakeflow Pipelines Editor preview must be enabled to enable the pipeline monitoring page. When the editor preview is enabled, the new monitoring page is also enabled by default.
-
Click Jobs & Pipelines.
-
Click the name of any pipeline to view the details for the pipeline.
-
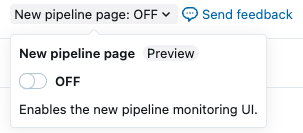
At the top of the page, enable the updated monitoring UI with the New pipeline page toggle.
Data Engineering Agent
This feature is in Public Preview.
The Lakeflow Pipelines Editor integrates with the Databricks Assistant Data Engineering Agent, which can generate, modify, and debug entire Lakeflow Spark Declarative Pipelines directly from natural language. For more information, see Use the Data Engineering Agent.
Limitations and known issues
See the following limitations and known issues for the ETL pipeline editor in Lakeflow Spark Declarative Pipelines:
-
The workspace browser sidebar does not focus on the pipeline if you start by opening a file in the
explorationsfolder or a notebook, as these files or notebooks are not part of the pipeline source code definition.To enter the pipeline focus mode in the workspace browser, open a file associated with the pipeline.
-
Data previews are not supported for regular views.
-
Python modules are not found from within a UDF, even if they are in your root folder or are on your
sys.path. You can access these modules by appending the path to thesys.pathfrom within the UDF, for example:sys.path.append(os.path.abspath(“/Workspace/Users/path/to/modules”)) -
%pip installis not supported from files (the default asset type with the new editor). You can add dependencies in settings. See Pipeline environment.Alternately, you can continue to use
%pip installfrom a notebook associated with a pipeline, in its source code definition.
FAQ
-
Why use files and not notebooks for source code?
The cell-based execution of notebooks is not compatible with pipelines. Standard features of notebooks are either disabled or changed when working with pipelines, which leads to confusion for users familiar with notebook behavior.
In the Lakeflow Pipelines Editor, the file editor is used as a foundation for a first-class editor for pipelines. Features are targeted explicitly to pipelines, like Run table
, rather than overloading familiar features with different behavior. -
Can I still use notebooks as source code?
Yes, you can. However, some features, such as Run table
or Run file, are not present.If you have an existing pipeline using notebooks, it still works in the new editor. However, Databricks recommends switching to files for new pipelines.
-
How can I add existing code to a newly created Pipeline?
You can add existing source code files to a new pipeline. To add a folder with existing files, follow these steps:
- Click Settings.
- Under Source code click Configure paths.
- Click Add path and choose the folder for the existing files.
- Click Save.
You can also add individual files:
- Click All files in the pipeline assets browser.
- Navigate to your file, click , and click Include in pipeline.
Consider moving these files to the pipeline root folder. If left outside the pipeline root folder, they are shown in the External files section.
-
Can I manage the Pipeline source code in Git?
You can manage your pipeline source in Git by choosing a Git folder when you initially create the pipeline.
noteManaging your source in a Git folder adds version control for your source code. However, to version control your configuration, Databricks recommends using Databricks Asset Bundles to define the pipeline configuration in bundle configuration files that can be stored in Git (or another version control system). For more information, see What are Databricks Asset Bundles?.
If you didn't create the pipeline in a Git folder initially, you can move your source to a Git folder. Databricks recommends using the editor action to move the entire root folder to a Git folder. This updates all settings accordingly. See Root folder.
To move the root folder to a Git folder in the pipeline asset browser:
- Click for the root folder.
- Click Move root folder.
- Choose a new location for your root folder and click Move.
See the Root folder section for more information.
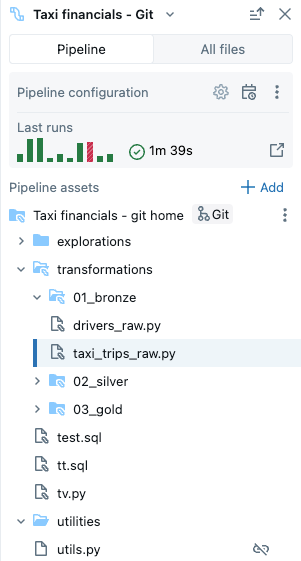
After the move, you see the familiar Git icon next to your root folder's name.
importantTo move the pipeline root folder, use the pipeline assets browser and the above steps. Moving it any other way breaks the pipeline configurations, and you must manually configure the correct folder path in Settings.
- Click
-
Can I have multiple Pipelines in the same root folder?
You can, but Databricks recommends only having a single Pipeline per root folder.
-
When should I run a dry run?
Click Dry run to check your code without updating the tables.
-
When should I use temporary Views, and when should I use materialized views in my code?
Use temporary views when you do not want to materialize the data. For example, this is a step in a sequence of steps to prepare the data before it is ready to materialize using a streaming table or materialized view registered in the Catalog.