Monitor GenAI in production
This feature is in Beta. Workspace admins can control access to this feature from the Previews page. See Manage Databricks previews.
Production monitoring for GenAI on Databricks lets you automatically run MLflow 3 scorers on traces from your production GenAI apps to continuously monitor quality.
You can schedule scorers to automatically evaluate a sample of your production traffic. Scorer assessment results are automatically attached as feedback to evaluated traces.
Production monitoring includes the following:
- Automated quality assessment using built-in or custom scorers, including multi-turn judges for evaluating entire conversations.
- Configurable sampling rates so you can control the tradeoff between coverage and computational cost.
- Use the same scorers in development and production to ensure consistent evaluation.
- Continuous quality assessment with monitoring running in the background.
MLflow 3 production monitoring is compatible with traces logged from MLflow 2.
Prerequisites
Before setting up quality monitoring, ensure you have:
- MLflow Experiment: An MLflow experiment where traces are being logged. If no experiment is specified, the active experiment is used.
- Instrumented production application: Your GenAI app must be logging traces using MLflow Tracing. See the Production Tracing guide.
- Defined scorers: Tested scorers that work with your application's trace format. If you used your production app as the
predict_fninmlflow.genai.evaluate()during development, your scorers are likely already compatible.
- SQL warehouse ID (for Unity Catalog traces): If your traces are stored in Unity Catalog, you must configure a SQL warehouse ID for monitoring to work. See Enable production monitoring.
Get started with production monitoring
This section includes example code showing how to create the different types of scorers.
For more information about scorers, see the following:
At any given time, at most 20 scorers can be associated with an experiment for continuous quality monitoring.
Create and schedule LLM judges using the UI
You can use the MLflow UI to create and test scorers based on LLM judges.
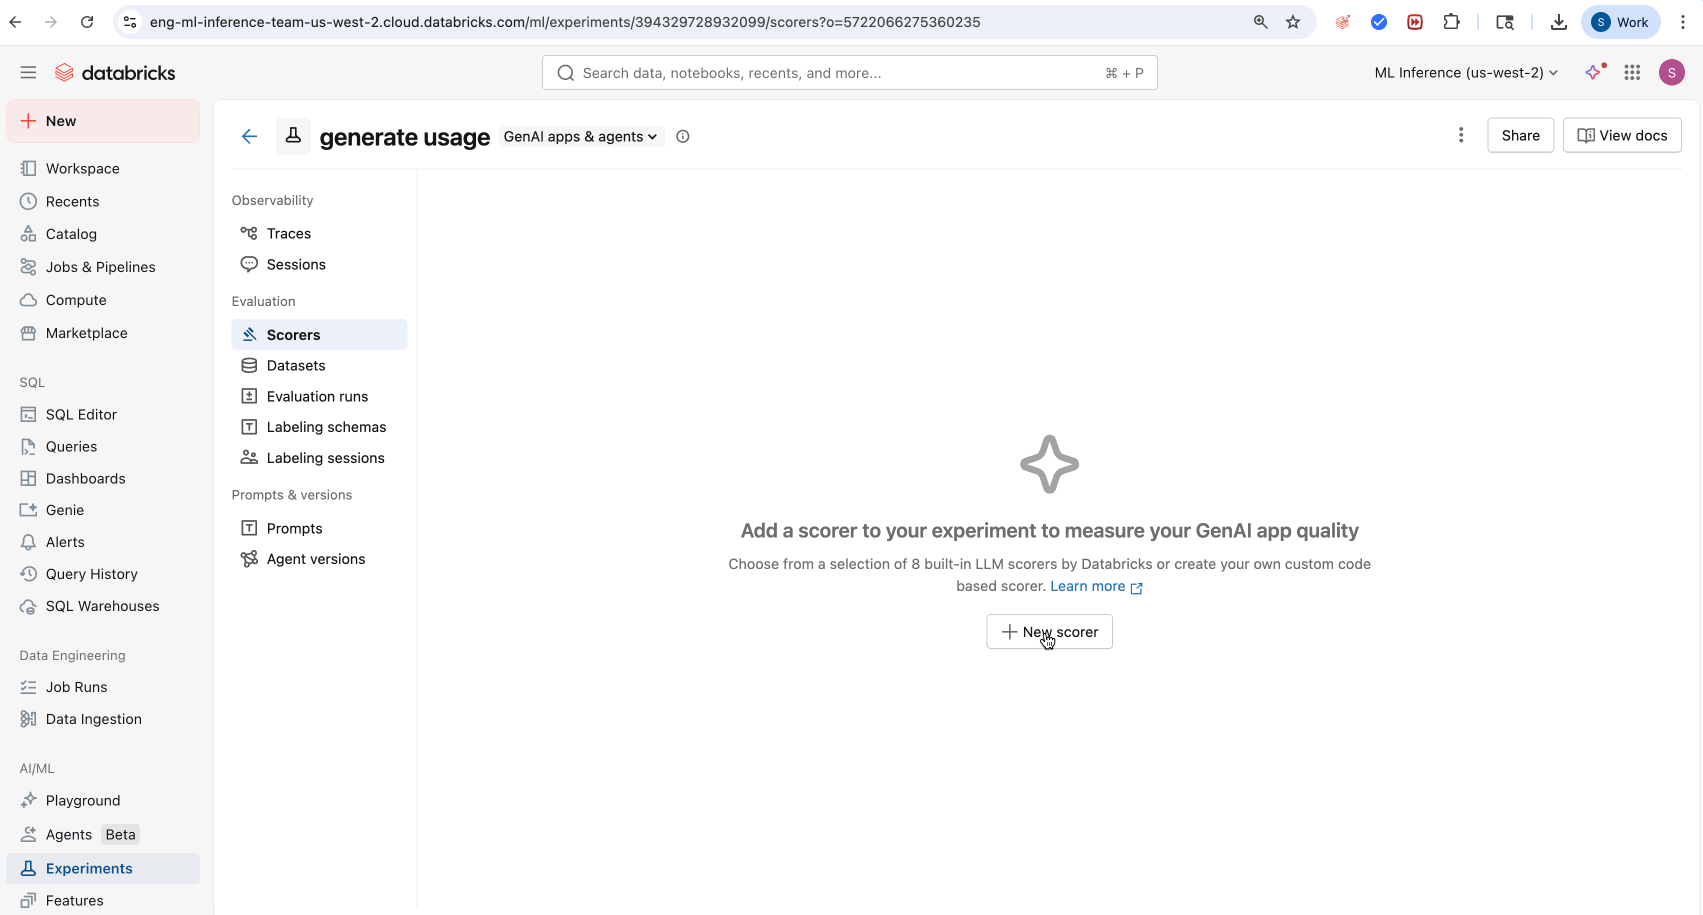
- Navigate to the Scorers tab in the MLflow Experiment UI.
- Click New Scorer.
- Select your built-in LLM judge from the LLM Template drop-down menu.
- (Optional) Click Run Scorer to run on a subset of your traces.
- (Optional) Adjust Evaluation settings for production monitoring on future traces.
- Click Create scorer.
Use built-in LLM judges
MLflow provides several built-in LLM judges that you can use out-of-the-box for monitoring.
from mlflow.genai.scorers import Safety, ScorerSamplingConfig

# Register the scorer with a name and start monitoring
safety_judge = Safety().register(name="my_safety_judge")  # name must be unique to experiment
safety_judge = safety_judge.start(sampling_config=ScorerSamplingConfig(sample_rate=0.7))
By default, each judge uses a Databricks-hosted LLM designed to perform GenAI quality assessments. You can change the judge model to instead use a Databricks model serving endpoint by using the model argument in the scorer definition. The model must be specified in the format databricks:/<databricks-serving-endpoint-name>.
safety_judge = Safety(model="databricks:/databricks-gpt-oss-20b").register(name="my_custom_safety_judge")
Use Guidelines LLM Judges
Guidelines LLM Judges evaluate inputs and outputs using pass/fail natural language criteria.
from mlflow.genai.scorers import Guidelines

# Create and register the guidelines scorer
english_judge = Guidelines(
  name="english",
  guidelines=["The response must be in English"]
).register(name="is_english")  # name must be unique to experiment

# Start monitoring with the specified sample rate
english_judge = english_judge.start(sampling_config=ScorerSamplingConfig(sample_rate=0.7))
Like built-in judges, you can change the judge model to instead use a Databricks model serving endpoint.
english_judge = Guidelines(
  name="english",
  guidelines=["The response must be in English"],
  model="databricks:/databricks-gpt-oss-20b",
).register(name="custom_is_english")
Use LLM Judges with custom prompts
For more flexibility than Guidelines judges, use LLM Judges with custom prompts which allow for multi-level quality assessment with customizable choice categories.
from typing import Literal
from mlflow.genai import make_judge
from mlflow.genai.scorers import ScorerSamplingConfig

# Create a custom judge using make_judge
formality_judge = make_judge(
    name="formality",
    instructions="""You will look at the response and determine the formality of the response.

Request: {{ inputs }}
Response: {{ outputs }}

Evaluate whether the response is formal, somewhat formal, or not formal.
A response is somewhat formal if it mentions friendship, etc.""",
    feedback_value_type=Literal["formal", "semi_formal", "not_formal"],
    model="databricks:/databricks-gpt-oss-20b",  # optional
)

# Register the custom judge and start monitoring
registered_judge = formality_judge.register(name="my_formality_judge")  # name must be unique to experiment
registered_judge = registered_judge.start(sampling_config=ScorerSamplingConfig(sample_rate=0.1))
Use custom scorer functions
For maximum flexibility, define and use a custom scorer function.
- Only
@scorerdecorator-based scorers are supported. Class-basedScorersubclasses cannot be registered for production monitoring. If you need a class-based scorer, refactor it to use the@scorerdecorator instead. - Scorers must be defined and registered from a Databricks notebook. The monitoring service serializes the scorer function code for remote execution, and this serialization requires the notebook environment. Scorers defined in standalone Python files or local IDE environments cannot be serialized for production monitoring.
- Scorers must be self-contained. Because scorer functions are serialized as code for remote execution, all imports must be done inline within the function body. The function cannot reference variables, objects, or modules defined outside of it.
When defining custom scorers, do not use type hints that need to be imported in the function signature. If the scorer function body uses packages that need to be imported, import these packages inline within the function to ensure proper serialization.
Some packages are available by default without the need for an inline import. These include databricks-agents, mlflow-skinny, openai, and all packages included in Serverless environment version 2.
from mlflow.genai.scorers import scorer, ScorerSamplingConfig


# Custom metric: Check if response mentions Databricks
@scorer
def mentions_databricks(outputs):
    """Check if the response mentions Databricks"""
    return "databricks" in str(outputs.get("response", "")).lower()

# Custom metric: Response length check
@scorer(aggregations=["mean", "min", "max"])
def response_length(outputs):
    """Measure response length in characters"""
    return len(str(outputs.get("response", "")))

# Custom metric with multiple inputs
@scorer
def response_relevance_score(inputs, outputs):
    """Score relevance based on keyword matching"""
    query = str(inputs.get("query", "")).lower()
    response = str(outputs.get("response", "")).lower()

    # Simple keyword matching (replace with your logic)
    query_words = set(query.split())
    response_words = set(response.split())

    if not query_words:
        return 0.0

    overlap = len(query_words & response_words)
    return overlap / len(query_words)

# Register and start monitoring custom scorers
databricks_scorer = mentions_databricks.register(name="databricks_mentions")
databricks_scorer = databricks_scorer.start(sampling_config=ScorerSamplingConfig(sample_rate=0.5))

length_scorer = response_length.register(name="response_length")
length_scorer = length_scorer.start(sampling_config=ScorerSamplingConfig(sample_rate=1.0))

relevance_scorer = response_relevance_score.register(name="response_relevance_score")  # name must be unique to experiment
relevance_scorer = relevance_scorer.start(sampling_config=ScorerSamplingConfig(sample_rate=1.0))
Use multi-turn judges
Production monitoring supports multi-turn judges that evaluate entire conversations rather than individual traces. These judges assess quality patterns that emerge over multiple interactions, such as user frustration, conversation completeness, and knowledge retention.
Multi-turn judges are registered and started exactly like single-turn judges. The monitoring job automatically groups traces into conversations based on the mlflow.trace.session tag. Multi-turn judges run after a conversation is considered complete — by default, a conversation is complete when no new traces with that session ID are ingested for 5 minutes. To configure this buffer, set the MLFLOW_ONLINE_SCORING_DEFAULT_SESSION_COMPLETION_BUFFER_SECONDS environment variable on the monitoring job.
To use multi-turn judges, your agent must set session IDs on traces. See Track users and sessions for details.
from mlflow.genai.scorers import (
    ConversationCompleteness,
    UserFrustration,
    ConversationalSafety,
    ScorerSamplingConfig,
)

# Register and start multi-turn judges just like single-turn judges
completeness_scorer = ConversationCompleteness().register(name="conversation_completeness")
completeness_scorer = completeness_scorer.start(
    sampling_config=ScorerSamplingConfig(sample_rate=1.0),
)

frustration_scorer = UserFrustration().register(name="user_frustration")
frustration_scorer = frustration_scorer.start(
    sampling_config=ScorerSamplingConfig(sample_rate=1.0),
)

safety_scorer = ConversationalSafety().register(name="conversational_safety")
safety_scorer = safety_scorer.start(
    sampling_config=ScorerSamplingConfig(sample_rate=0.5),
)
For the complete list of available multi-turn judges, see Multi-turn judges. For details on conversation evaluation, see Evaluate conversations.
Multiple scorer configuration
For comprehensive monitoring setup, register and start multiple scorers individually. You can combine single-turn and multi-turn judges in the same experiment.
from mlflow.genai.scorers import Safety, Guidelines, UserFrustration, ScorerSamplingConfig, list_scorers

# Register single-turn judges
safety_judge = Safety().register(name="safety") # name must be unique within an MLflow experiment
safety_judge = safety_judge.start(
    sampling_config=ScorerSamplingConfig(sample_rate=1.0), # Check all traces
)

guidelines_judge = Guidelines(
    name="english",
    guidelines=["Response must be in English"]
).register(name="english_check")
guidelines_judge = guidelines_judge.start(
    sampling_config=ScorerSamplingConfig(sample_rate=0.5), # Sample 50%
)

# Register multi-turn judges alongside single-turn judges
frustration_judge = UserFrustration().register(name="user_frustration")
frustration_judge = frustration_judge.start(
    sampling_config=ScorerSamplingConfig(sample_rate=1.0), # Check all sessions
)

# List and manage all judges (both single-turn and multi-turn)
all_scorers = list_scorers()
for scorer in all_scorers:
    if scorer.sample_rate > 0:
        print(f"{scorer.name} is active")
    else:
        print(f"{scorer.name} is stopped")
Scorer lifecycle
Scorer lifecycles are centered around MLflow experiments. The following table lists the scorer lifecycle states.
Scorers are immutable, so a lifecycle operation does not modify the original scorer. Instead, it returns a new scorer instance.
State | Description | API |
|---|---|---|
Unregistered | Scorer function is defined but is not known to the server. | |
Registered | Scorer is registered to the active MLflow experiment. | |
Active | Scorer is running with a sample rate > 0. | |
Stopped | Scorer is registered but not running (sample rate = 0). | |
Deleted | The scorer has been removed from the server and is no longer associated with its MLflow experiment. |
Basic scorer lifecycle
from mlflow.genai.scorers import Safety, scorer, ScorerSamplingConfig

# Built-in scorer lifecycle
safety_judge = Safety().register(name="safety_check")
safety_judge = safety_judge.start(
    sampling_config=ScorerSamplingConfig(sample_rate=1.0),
)
safety_judge = safety_judge.update(
    sampling_config=ScorerSamplingConfig(sample_rate=0.8),
)
safety_judge = safety_judge.stop()
delete_scorer(name="safety_check")

# Custom scorer lifecycle
@scorer
def response_length(outputs):
    return len(str(outputs.get("response", "")))

length_scorer = response_length.register(name="length_check")
length_scorer = length_scorer.start(
    sampling_config=ScorerSamplingConfig(sample_rate=0.5),
)
Manage scorers
The following APIs are available to manage scorers.
API | Description | Example |
|---|---|---|
List all registered scorers for the current experiment. | ||
Retrieve a registered scorer by name. | ||
Modify the sampling configuration of an active scorer. This is an immutable operation. | ||
Retroactively apply new or updated metrics to historical traces. | ||
Delete a registered scorer by name. |
List current scorers
To view all registered scorers for your experiment:
from mlflow.genai.scorers import list_scorers

# List all registered scorers
scorers = list_scorers()
for scorer in scorers:
    print(f"Name: {scorer._server_name}")
    print(f"Sample rate: {scorer.sample_rate}")
    print(f"Filter: {scorer.filter_string}")
    print("---")
Get and update a scorer
To modify existing scorer configurations:
from mlflow.genai.scorers import get_scorer

# Get existing scorer and update its configuration (immutable operation)
safety_judge = get_scorer(name="safety_monitor")
updated_judge = safety_judge.update(sampling_config=ScorerSamplingConfig(sample_rate=0.8))  # Increased from 0.5

# Note: The original scorer remains unchanged; update() returns a new scorer instance
print(f"Original sample rate: {safety_judge.sample_rate}")  # Original rate
print(f"Updated sample rate: {updated_judge.sample_rate}")   # New rate
Stop and delete scorers
To stop monitoring or remove a scorer entirely:
from mlflow.genai.scorers import get_scorer, delete_scorer

# Get existing scorer
databricks_scorer = get_scorer(name="databricks_mentions")

# Stop monitoring (sets sample_rate to 0, keeps scorer registered)
stopped_scorer = databricks_scorer.stop()
print(f"Sample rate after stop: {stopped_scorer.sample_rate}")  # 0

# Remove scorer entirely from the server
delete_scorer(name=databricks_scorer.name)

# Or restart monitoring from a stopped scorer
restarted_scorer = stopped_scorer.start(sampling_config=ScorerSamplingConfig(sample_rate=0.5))
Immutable updates
Scorers, including LLM Judges, are immutable objects. When you update a scorer, you do not modify the original scorer. Instead, an updated copy of the scorer is created. This immutability helps ensure that scorers meant for production are not accidentally modified. The following code snippet shows how immutable updates work.
# Demonstrate immutability
original_judge = Safety().register(name="safety")
original_judge = original_judge.start(
   sampling_config=ScorerSamplingConfig(sample_rate=0.3),
)

# Update returns new instance
updated_judge = original_judge.update(
    sampling_config=ScorerSamplingConfig(sample_rate=0.8),
)

# Original remains unchanged
print(f"Original: {original_judge.sample_rate}")  # 0.3
print(f"Updated: {updated_judge.sample_rate}")    # 0.8
Evaluate historical traces (metric backfill)
You can retroactively apply new or updated metrics to historical traces.
Basic metric backfill using current sample rates
from databricks.agents.scorers import backfill_scorers

safety_judge = Safety()
safety_judge.register(name="safety_check")
safety_judge.start(sampling_config=ScorerSamplingConfig(sample_rate=0.5))

#custom scorer
@scorer(aggregations=["mean", "min", "max"])
def response_length(outputs):
    """Measure response length in characters"""
    return len(outputs)

response_length.register(name="response_length")
response_length.start(sampling_config=ScorerSamplingConfig(sample_rate=0.5))

# Use existing sample rates for specified scorers
job_id = backfill_scorers(
    scorers=["safety_check", "response_length"]
)
Metric backfill using custom sample rates and time range
from databricks.agents.scorers import backfill_scorers, BackfillScorerConfig
from datetime import datetime
from mlflow.genai.scorers import Safety, Correctness

safety_judge = Safety()
safety_judge.register(name="safety_check")
safety_judge.start(sampling_config=ScorerSamplingConfig(sample_rate=0.5))

#custom scorer
@scorer(aggregations=["mean", "min", "max"])
def response_length(outputs):
    """Measure response length in characters"""
    return len(outputs)

response_length.register(name="response_length")
response_length.start(sampling_config=ScorerSamplingConfig(sample_rate=0.5))

# Define custom sample rates for backfill
custom_scorers = [
    BackfillScorerConfig(scorer=safety_judge, sample_rate=0.8),
    BackfillScorerConfig(scorer=response_length, sample_rate=0.9)
]

job_id = backfill_scorers(
    experiment_id=YOUR_EXPERIMENT_ID,
    scorers=custom_scorers,
    start_time=datetime(2024, 6, 1),
    end_time=datetime(2024, 6, 30)
)
Recent data backfill
from datetime import datetime, timedelta

# Backfill last week's data with higher sample rates
one_week_ago = datetime.now() - timedelta(days=7)

job_id = backfill_scorers(
    scorers=[
        BackfillScorerConfig(scorer=safety_judge, sample_rate=0.8),
        BackfillScorerConfig(scorer=response_length, sample_rate=0.9)
    ],
    start_time=one_week_ago
)
View results
After scheduling scorers, allow 15-20 minutes for initial processing. Then:
- Navigate to your MLflow experiment.
- Open the Traces tab to see assessments attached to traces.
- Use the monitoring dashboards to track quality trends.
For multi-turn judges, assessments are attached to the first trace in each session. See How assessments are stored for details.
Best practices
Scorer state management
- Check the scorer state before operations using
sample_rate. - Use the immutable pattern. Assign the results of
.start(),.update(),.stop()to variables. - Understand the scorer lifecycle.
.stop()preserves registration,delete_scorer()removes the scorer entirely.
Metric backfill
- Start small. Begin with smaller time ranges to estimate job duration and resource usage.
- Use appropriate sample rates. Consider the cost and time implications of using high sample rates.
Sampling strategy
-
For critical scorers such as safety and security checks, use
sample_rate=1.0. -
For expensive scorers, such as complex LLM judges, use lower sample rates (0.05-0.2).
-
For iterative improvement during development, use moderate rates (0.3-0.5).
-
Balance coverage with cost, as shown in the following examples:
Python# High-priority scorers: higher sampling
safety_judge = Safety().register(name="safety")
safety_judge = safety_judge.start(sampling_config=ScorerSamplingConfig(sample_rate=1.0)) # 100% coverage for critical safety
# Expensive scorers: lower sampling
complex_scorer = ComplexCustomScorer().register(name="complex_analysis")
complex_scorer = complex_scorer.start(sampling_config=ScorerSamplingConfig(sample_rate=0.05)) # 5% for expensive operations
Custom scorer design
Keep custom scorers self-contained, as shown in the following example:
@scorer
def well_designed_scorer(inputs, outputs):
    # All imports inside the function
    import re
    import json

    # Handle missing data gracefully
    response = outputs.get("response", "")
    if not response:
        return 0.0

    # Return consistent types
    return float(len(response) > 100)
Troubleshooting
Scorers not running
If scorers aren't executing, check the following:
- Check experiment: Ensure that traces are logged to the experiment, not to individual runs.
- Sampling rate: With low sample rates, it might take time to see results.
- Verify filter string: Ensure your
filter_stringmatches actual traces.
Serialization issues
Custom scorers for production monitoring are serialized so they can be executed remotely by the monitoring service. This imposes several constraints:
- Notebook requirement: Custom
@scorerfunctions must be defined and registered from a Databricks notebook. The serialization mechanism relies on the notebook environment. - Self-contained functions: All imports must be inline within the function body. References to external variables, modules, or objects defined outside the function are not captured during serialization.
- No class-based scorers: Only
@scorerdecorator-based scorers can be registered. Class-basedScorersubclasses cannot be serialized for remote execution. - No type hints requiring imports: Type hints in the function signature that require import statements (for example,
Listfromtyping) cause serialization failures.
When you create a custom scorer, include imports in the function definition.
# ❌ Avoid external dependencies
import external_library  # Outside function

@scorer
def bad_scorer(outputs):
    return external_library.process(outputs)

# ✅ Include imports in the function definition
@scorer
def good_scorer(outputs):
    import json  # Inside function
    return len(json.dumps(outputs))

# ❌ Avoid using type hints in scorer function signature that requires imports
from typing import List

@scorer
def scorer_with_bad_types(outputs: List[str]):
    return False

# ❌ Class-based scorers are not supported for production monitoring
class MyScorer(Scorer):
    name: str = "my_scorer"
    def __call__(self, outputs):
        return len(outputs) > 10
Metric backfill issues
"Scheduled scorer 'X' not found in experiment"
- Ensure the scorer name matches a registered scorer in your experiment.
- Check available scorers using
list_scorersmethod.
Archive traces
You can save traces and their associated assessments to a Unity Catalog Delta table for long-term storage and advanced analysis. This is useful for building custom dashboards, performing in-depth analytics on trace data, and maintaining a durable record of your application's behavior.
You must have the necessary permissions to write to the specified Unity Catalog Delta table. The target table will be created if it does not already exist.
If the table already exists, traces are appended to it.
Enable archiving traces
- MLflow API
- Databricks UI
To begin archiving traces for an experiment, use the enable_databricks_trace_archival function. You must specify the full name of the target Delta table, including catalog and schema. If you don't provide an experiment_id, archiving traces is enabled for the currently active experiment.
from mlflow.tracing.archival import enable_databricks_trace_archival

# Archive traces from a specific experiment to a Unity Catalog Delta table
enable_databricks_trace_archival(
    delta_table_fullname="my_catalog.my_schema.archived_traces",
    experiment_id="YOUR_EXPERIMENT_ID",
)
Stop archiving traces for an experiment at any time by using the disable_databricks_trace_archival function.
from mlflow.tracing.archival import disable_databricks_trace_archival

# Stop archiving traces for the specified experiment
disable_databricks_trace_archival(experiment_id="YOUR_EXPERIMENT_ID")
To archive traces for an experiment in the UI:
- Go to Experiments page in the Databrick workspace.
- Click Delta sync: Not enabled.
- Specify the full name of the target Delta table, including catalog and schema.
To disable trace archiving:
- Go to Experiments page in the Databrick workspace.
- Click Delta sync: Enabled > Disable syncing.
Next steps
- Create custom scorers - Build scorers tailored to your needs.
- Evaluate conversations - Learn about multi-turn conversation evaluation and multi-turn judges.
- Build evaluation datasets - Use monitoring results to improve quality.
Reference guides
- Scorer lifecycle management API reference - API and examples for managing scorers for monitoring.
- Scorers - Understand the metrics that power monitoring.
- Evaluation Harness - How offline evaluation relates to production.