Slow Spark stage with little I/O
If you have a slow stage with not much I/O, this could be caused by:
- Reading a lot of small files
- Writing a lot of small files
- Slow UDF(s)
- Cartesian join
- Exploding join
Almost all of these issues can be identified using the SQL DAG.
Open the SQL DAG
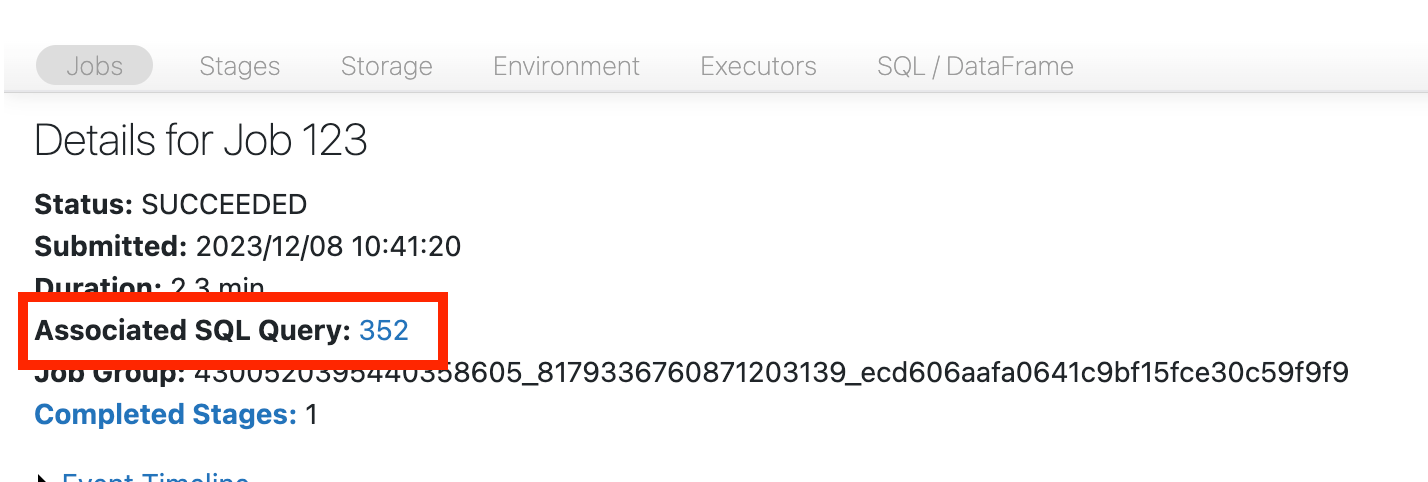
To open the SQL DAG, scroll up to the top of the job's page and click on Associated SQL Query:
You should now see the DAG. If not, scroll around a bit and you should see it:
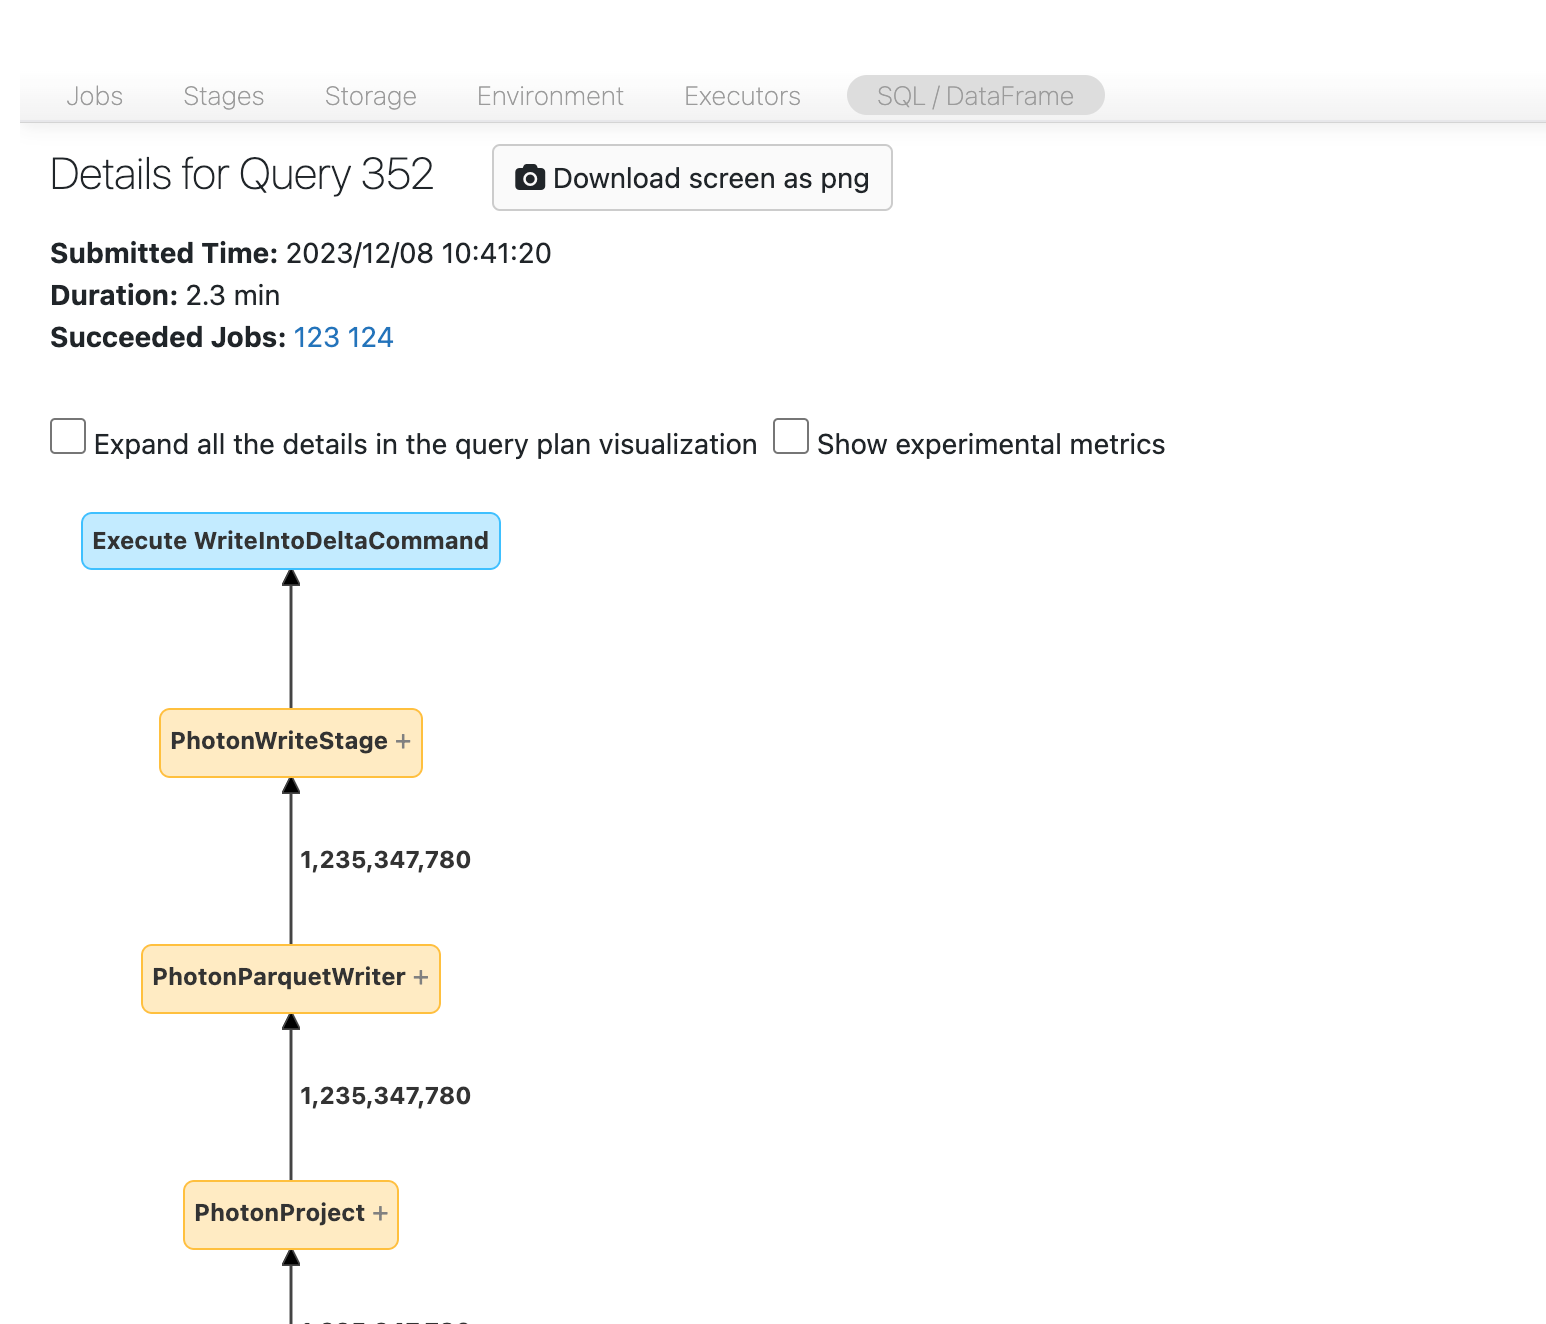
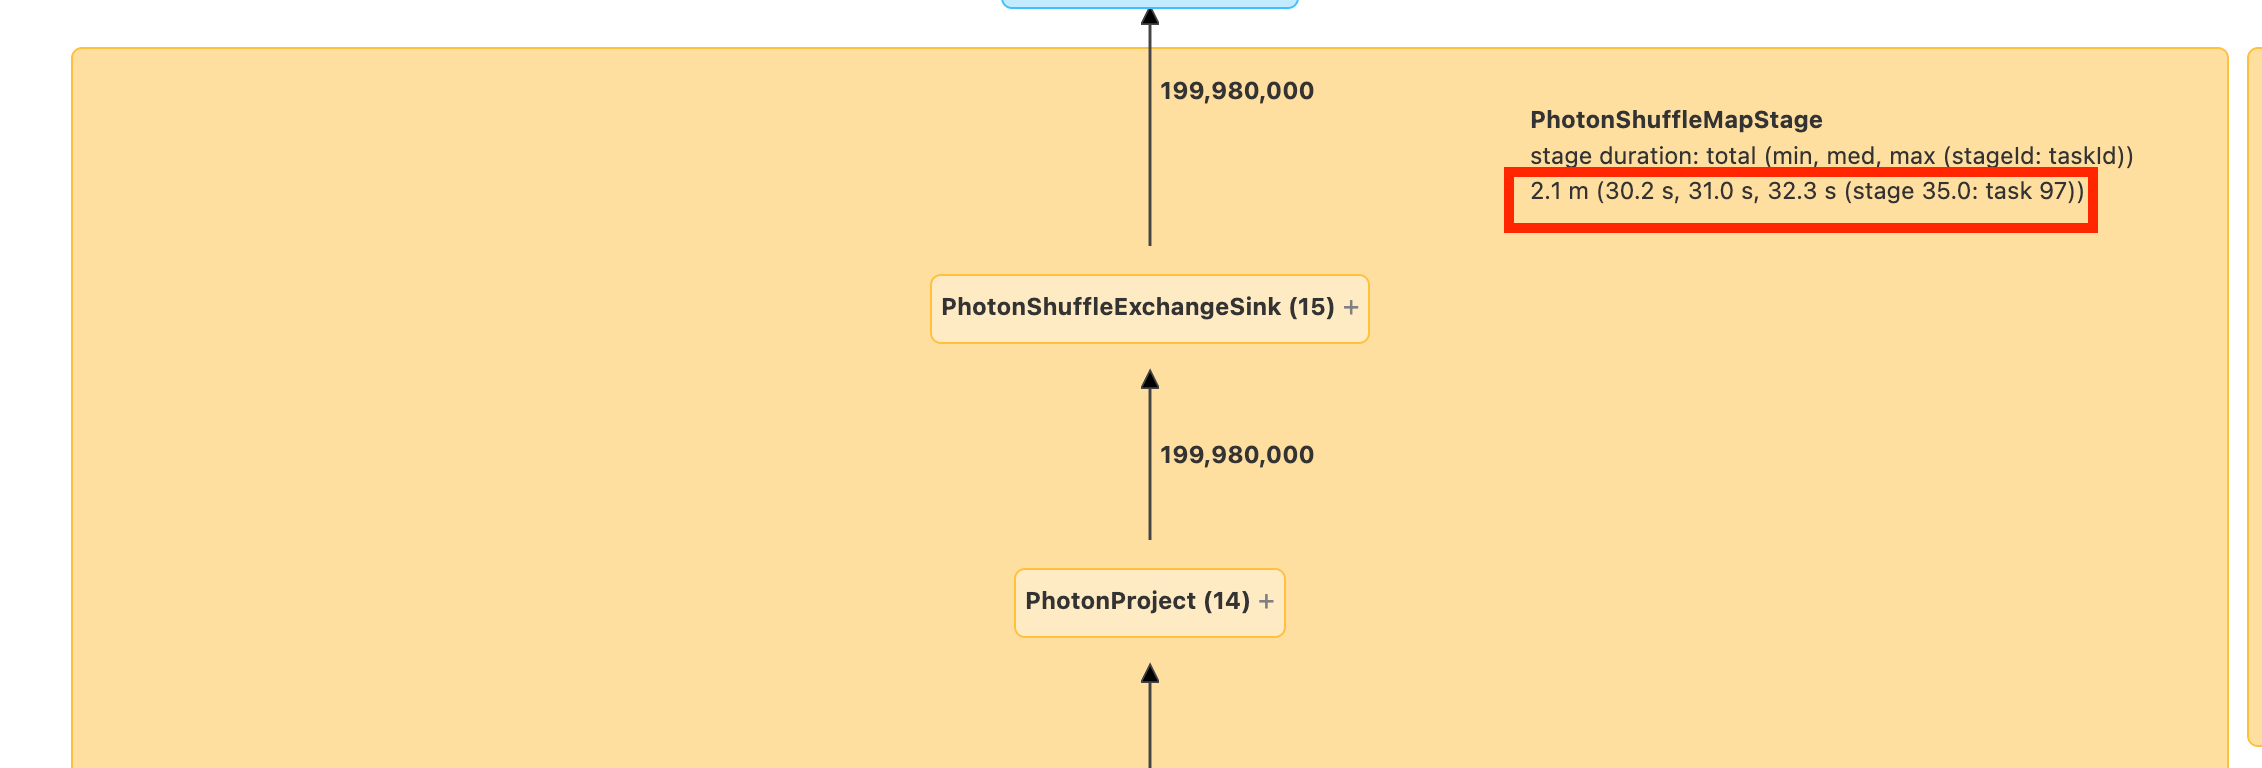
Before you move on, familiarize yourself with the DAG and where time is being spent. Some nodes in the DAG have helpful time information and others don't. For example, this block took 2.1 minutes and even provides the stage ID:
This node requires you to open it to see that it took 1.4 minutes:

These times are cumulative, so it's the total time spent on all the tasks, not the clock time. But it's still very useful as they are correlated with clock time and cost.
It's helpful to familiarize yourself with where in the DAG the time is being spent.
Reading a lot of small files
If you see one of your scan operators is taking a lot of time, open it up and look for the number of files read:
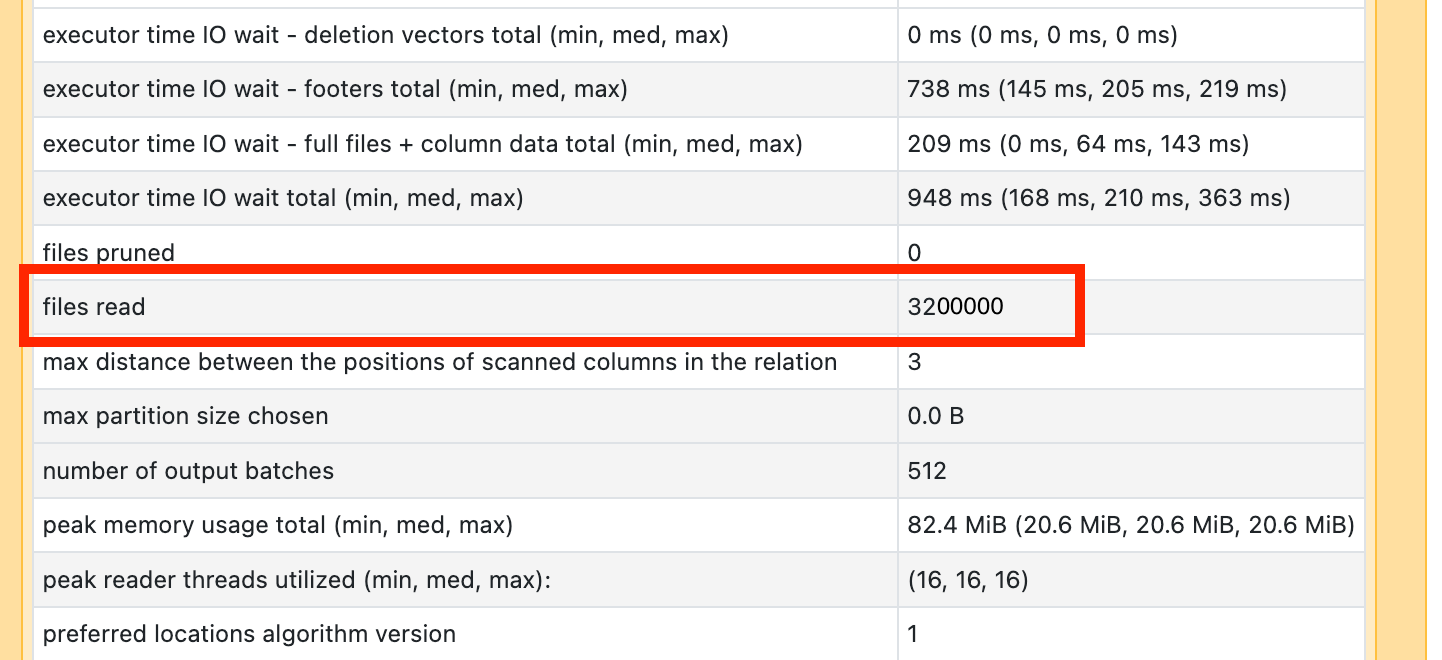
If you're reading tens of thousands of files or more, you may have a small file problem. Your files should be no less than 8MB. The small file problem is most often caused by partitioning on too many columns or a high-cardinality column.
If you're lucky, you might just need to run OPTIMIZE. Databricks recommends that you also enable predictive optimization and reconsider your file layout.
Writing a lot of small files
If you see your write is taking a long time, open it up and look for the number of files and how much data was written:
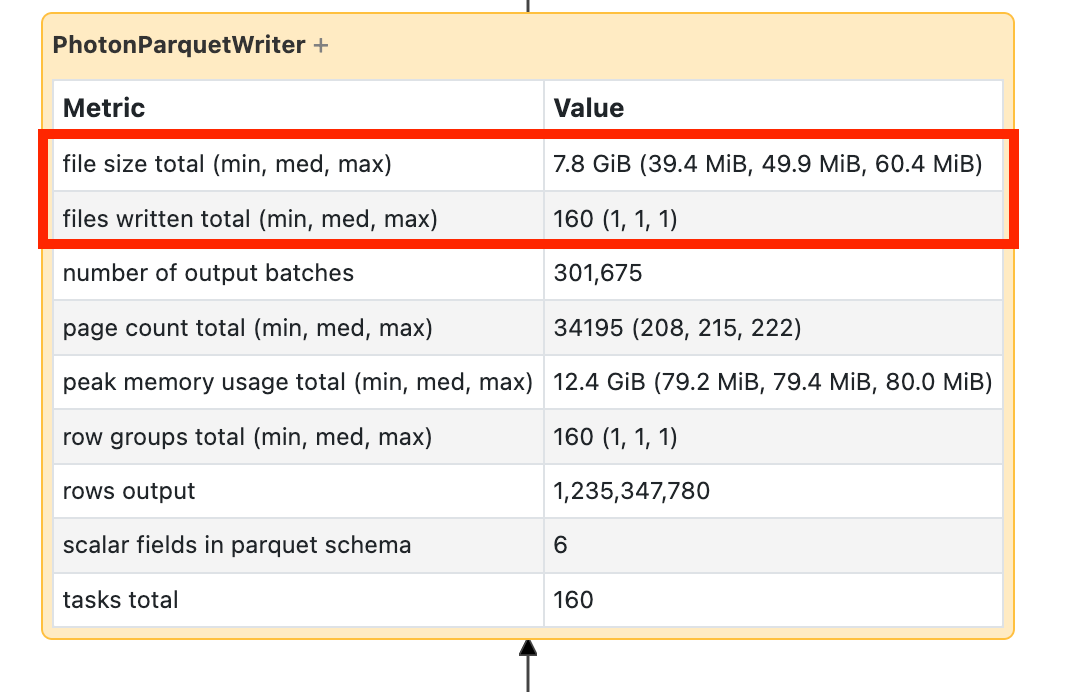
If you're writing tens of thousands of files or more, you may have a small file problem. Your files should be no less than 8MB. The small file problem is most often caused by partitioning on too many columns or a high-cardinality column. You need to enable predictive optimization, reconsider your file layout, or turn on optimized writes.
Slow UDFs
If you know you have UDFs, or see something like this in your DAG, you might be suffering from slow UDFs:
If you think you're suffering from this problem, try commenting out your UDF to see how it impacts the speed of your pipeline. If the UDF is indeed where the time is being spent, your best bet is to rewrite the UDF using native functions. If that's not possible, consider the number of tasks in the stage executing your UDF. If it's less than the number of cores on your cluster, repartition() your dataframe before using the UDF:
  (df
    .repartition(num_cores)
    .withColumn('new_col', udf(...))
  )
UDFs can also suffer from memory issues. Consider that each task may have to load all the data in its partition into memory. If this data is too big, things can get very slow or unstable. Repartition also can resolve this issue by making each task smaller.
Cartesian join
If you see a cartesian join or nested loop join in your DAG, you should know that these joins are very expensive. Make sure that's what you intended and see if there's another way.
Exploding join or explode
If you see a few rows going into a node and magnitudes more coming out, you may be suffering from an exploding join or explode():

Read more about explodes in the Databricks Optimization guide.