Monitor GenAI apps in production
This feature is in Beta. Workspace admins can control access to this feature from the Previews page. See Manage Databricks previews.
Production monitoring lets you automatically run MLflow 3 scorers on traces from your GenAI apps to continuously assess quality. You schedule scorers against an MLflow experiment, and the monitoring service evaluates a configurable sample of incoming traces. Results are attached as feedback to each evaluated trace.
Production monitoring includes the following:
- Automated quality assessment using built-in or custom scorers, including multi-turn judges for evaluating entire conversations.
- Configurable sampling rates so you can control the tradeoff between coverage and computational cost.
- Use the same scorers in development and production to ensure consistent evaluation.
- Continuous quality assessment with monitoring running in the background.
MLflow 3 production monitoring is compatible with traces logged from MLflow 2.
Prerequisites
Before setting up production monitoring, ensure you have:
- MLflow experiment: An MLflow experiment where traces are being logged. If no experiment is specified, the active experiment is used.
- Instrumented production application: Your GenAI app must log traces using MLflow Tracing. See the Production Tracing guide.
- Defined scorers: Tested scorers that work with your application's trace format. If you used your production app as the
predict_fninmlflow.genai.evaluate()during development, your scorers are likely already compatible. - Serverless budget policy: If your workspace does not allow the default serverless budget policy, set a policy on the MLflow experiment before registering scorers. See Configure a serverless budget policy for an MLflow experiment.
Get started
To set up production monitoring, you register a scorer with your MLflow experiment and then start it with a sampling configuration. This two-step pattern (.register() then .start()) applies to all scorer types.
At any given time, at most 20 scorers can be associated with an experiment for continuous quality monitoring.
For more information about scorers, see the following:
The following sections describe how to use the different types of judges and how to combine them. Expand a section to learn more.
Create and schedule LLM judges using the UI
Create and schedule LLM judges using the UI
You can use the MLflow experiment UI to create and test scorers based on LLM judges.
To create a new LLM judge:
-
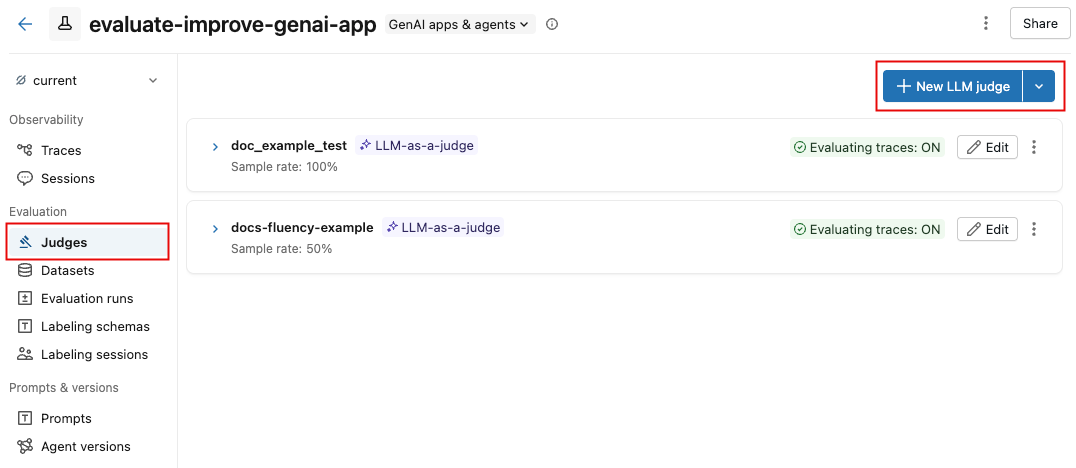
Navigate to the Judges tab in the MLflow Experiment UI.
-
Click New LLM judge.
-
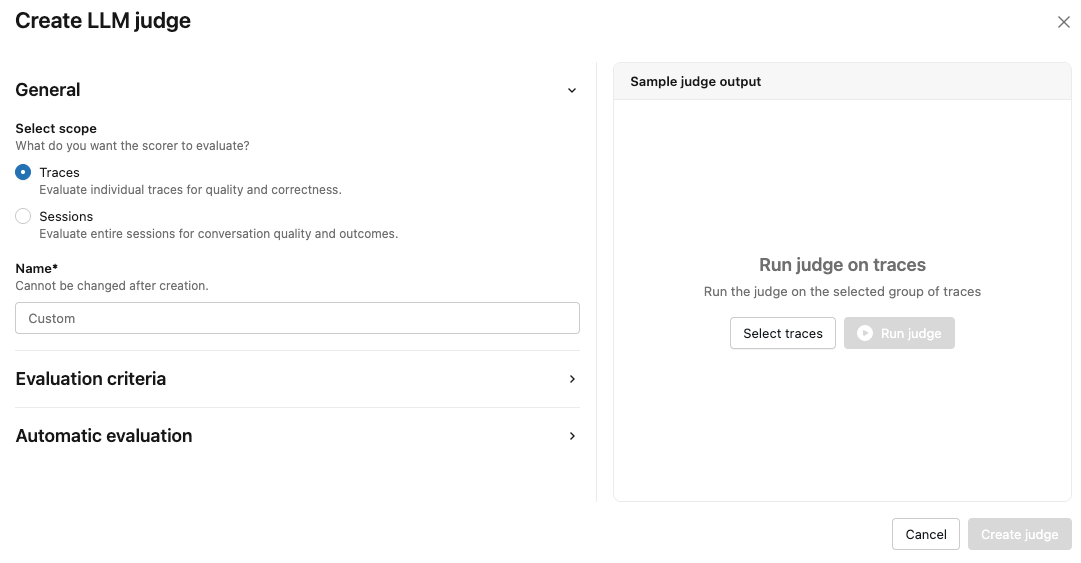
Specify what the scorer will evaluate by selecting Traces or Sessions.
-
Enter a name for the judge.
-
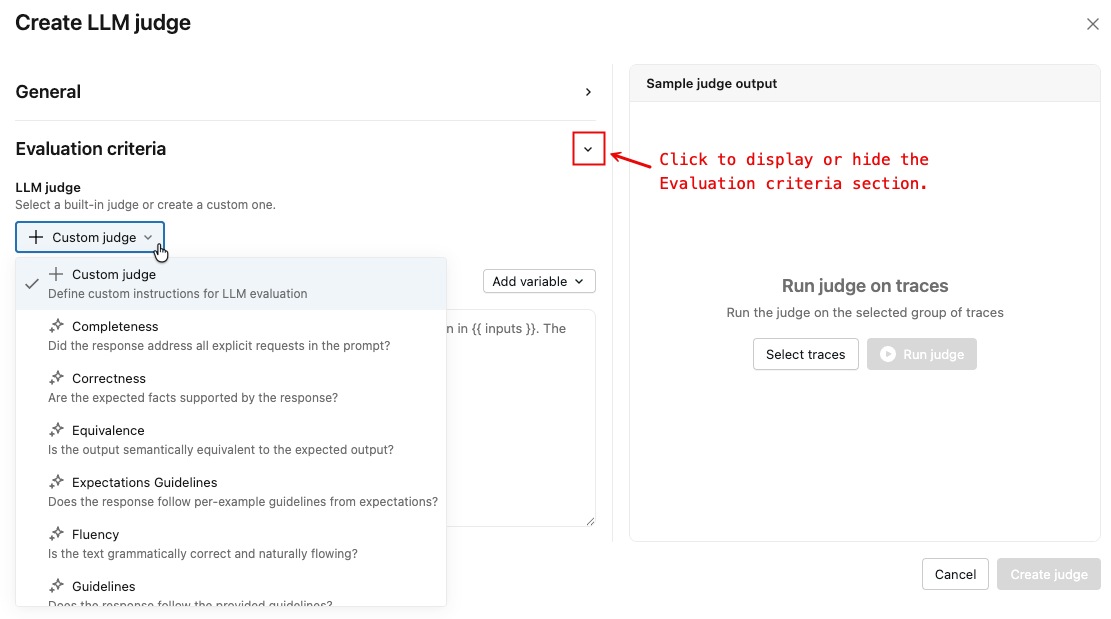
Click the arrow as shown to display the Evaluation criteria section.
-
From the drop-down menu, select the type of judge. Some judge types allow you to enter custom instructions including variables.
-
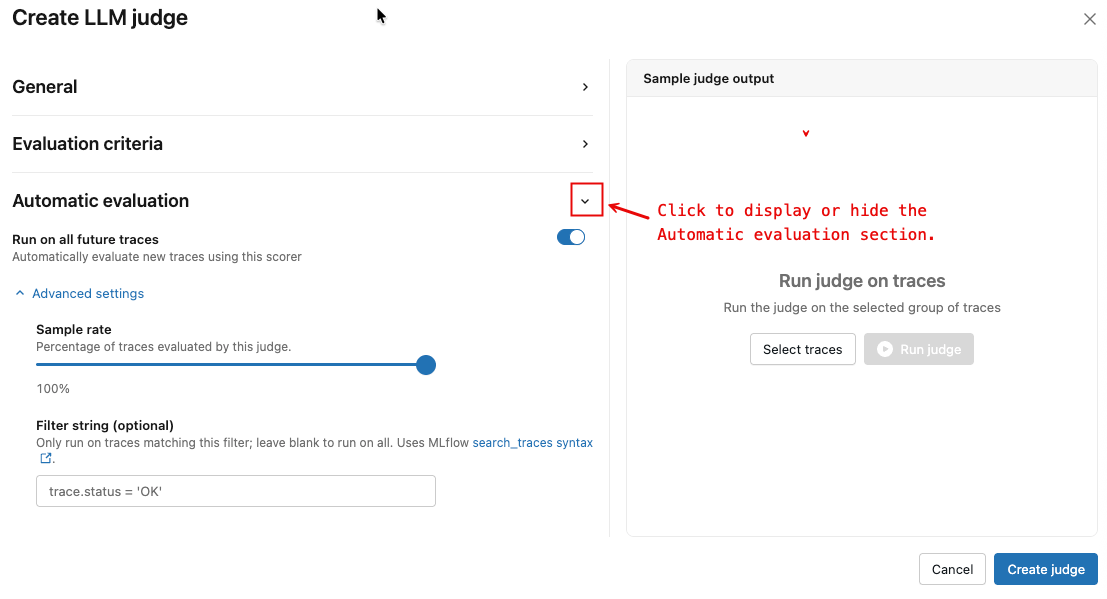
Click the arrow as shown to display the Automatic evaluation section.
-
Set the Run on all future traces toggle as desired.
-
(Optional) Under Advanced settings, adjust the Sample rate and Filter string to control which traces are evaluated.
-
(Optional) To test the new judge on a set of existing traces:
- Click Select traces in the left pane. A pop-up appears.
- Select the traces to run and click Select (n).
- Click Run judge. The traces are evaluated and the results are displayed.
- Review the results. Use the Next and Previous buttons to step through the results for each selected trace.
- If necessary, edit the judge and iterate until you are happy with the judge's performance.
-
To create the judge, click Create judge.
You cannot create a custom code judge using the UI. To see template code that you can copy to your notebook and edit as needed, do the following:
-
Click the dropdown arrow next to the New LLM judge button, and select Custom code judge.
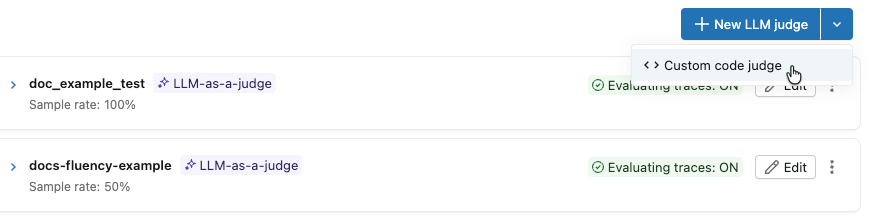
-
A pop-up appears with instructions and template code showing how to define and run the custom code judge.
Use built-in LLM judges
Use built-in LLM judges
MLflow provides several built-in LLM judges that you can use out-of-the-box.
from mlflow.genai.scorers import Safety, ScorerSamplingConfig

# Register the scorer with a name and start monitoring
safety_judge = Safety().register(name="my_safety_judge")  # name must be unique to experiment
safety_judge = safety_judge.start(sampling_config=ScorerSamplingConfig(sample_rate=0.7))
By default, each judge uses a Databricks-hosted LLM designed to perform GenAI quality assessments. You can change the judge model to instead use a Databricks model serving endpoint by using the model argument in the scorer definition. The model must be specified in the format databricks:/<databricks-serving-endpoint-name>.
safety_judge = Safety(model="databricks:/databricks-gpt-oss-20b").register(name="my_custom_safety_judge")
Use Guidelines LLM Judges
Use Guidelines LLM Judges
Guidelines LLM Judges evaluate inputs and outputs using pass/fail natural language criteria.
from mlflow.genai.scorers import Guidelines

# Create and register the guidelines scorer
english_judge = Guidelines(
  name="english",
  guidelines=["The response must be in English"]
).register(name="is_english")  # name must be unique to experiment

# Start monitoring with the specified sample rate
english_judge = english_judge.start(sampling_config=ScorerSamplingConfig(sample_rate=0.7))
Like built-in judges, you can change the judge model to instead use a Databricks model serving endpoint.
english_judge = Guidelines(
  name="english",
  guidelines=["The response must be in English"],
  model="databricks:/databricks-gpt-oss-20b",
).register(name="custom_is_english")
Use LLM Judges with custom prompts
Use LLM Judges with custom prompts
For more flexibility than Guidelines judges, use LLM Judges with custom prompts which allow for multi-level quality assessment with customizable choice categories.
from typing import Literal
from mlflow.genai import make_judge
from mlflow.genai.scorers import ScorerSamplingConfig

# Create a custom judge using make_judge
formality_judge = make_judge(
    name="formality",
    instructions="""You will look at the response and determine the formality of the response.

Request: {{ inputs }}
Response: {{ outputs }}

Evaluate whether the response is formal, somewhat formal, or not formal.
A response is somewhat formal if it mentions friendship, etc.""",
    feedback_value_type=Literal["formal", "semi_formal", "not_formal"],
    model="databricks:/databricks-gpt-oss-20b",  # optional
)

# Register the custom judge and start monitoring
registered_judge = formality_judge.register(name="my_formality_judge")  # name must be unique to experiment
registered_judge = registered_judge.start(sampling_config=ScorerSamplingConfig(sample_rate=0.1))
Use custom scorer functions
Use custom scorer functions
For maximum flexibility, define and use a custom scorer function.
- Only
@scorerdecorator-based scorers are supported. Class-basedScorersubclasses cannot be registered for production monitoring. If you need a class-based scorer, refactor it to use the@scorerdecorator instead. - Scorers must be defined and registered from a Databricks notebook. The monitoring service serializes the scorer function code for remote execution, and this serialization requires the notebook environment. Scorers defined in standalone Python files or local IDE environments cannot be serialized for production monitoring.
- Scorers must be self-contained. Because scorer functions are serialized as code for remote execution, all imports must be done inline within the function body. The function cannot reference variables, objects, or modules defined outside of it.
When defining custom scorers, do not use type hints that need to be imported in the function signature. If the scorer function body uses packages that need to be imported, import these packages inline within the function to ensure proper serialization.
Some packages are available by default without the need for an inline import. These include databricks-agents, mlflow-skinny, openai, and all packages included in Serverless environment version 2.
from mlflow.genai.scorers import scorer, ScorerSamplingConfig


# Custom metric: Check if response mentions Databricks
@scorer
def mentions_databricks(outputs):
    """Check if the response mentions Databricks"""
    return "databricks" in str(outputs.get("response", "")).lower()

# Register and start monitoring
databricks_scorer = mentions_databricks.register(name="databricks_mentions")
databricks_scorer = databricks_scorer.start(sampling_config=ScorerSamplingConfig(sample_rate=0.5))
For more custom scorer examples, see Code-based scorers.
Use multi-turn judges
Use multi-turn judges
Production monitoring supports multi-turn judges that evaluate entire conversations rather than individual traces. These judges assess quality patterns across multiple interactions, such as user frustration and conversation completeness. Multi-turn judges are registered and started the same way as single-turn judges.
The monitoring job automatically groups traces into conversations based on the mlflow.trace.session tag. Multi-turn judges run after a conversation is considered complete — by default, a conversation is complete when no new traces with that session ID are ingested for 5 minutes. To configure this buffer, set the MLFLOW_ONLINE_SCORING_DEFAULT_SESSION_COMPLETION_BUFFER_SECONDS environment variable on the monitoring job.
For the complete list of available multi-turn judges, see Multi-turn judges. For details on conversation evaluation, see Evaluate conversations.
To use multi-turn judges, your agent must set session IDs on traces. See Track users and sessions for details.
from mlflow.genai.scorers import (
    ConversationCompleteness,
    UserFrustration,
    ScorerSamplingConfig,
)

# Register and start multi-turn judges just like single-turn judges
completeness_scorer = ConversationCompleteness().register(name="conversation_completeness")
completeness_scorer = completeness_scorer.start(
    sampling_config=ScorerSamplingConfig(sample_rate=1.0),
)

frustration_scorer = UserFrustration().register(name="user_frustration")
frustration_scorer = frustration_scorer.start(
    sampling_config=ScorerSamplingConfig(sample_rate=1.0),
)
Combine judges
Combine judges
You can combine single-turn judges and multi-turn judges in the same experiment. Register and start each scorer individually.
from mlflow.genai.scorers import Safety, Guidelines, UserFrustration, ScorerSamplingConfig

# Single-turn judges
safety_judge = Safety().register(name="safety")
safety_judge = safety_judge.start(sampling_config=ScorerSamplingConfig(sample_rate=1.0))

english_judge = Guidelines(
    name="english",
    guidelines=["The response must be in English"]
).register(name="is_english")
english_judge = english_judge.start(sampling_config=ScorerSamplingConfig(sample_rate=0.5))

# Multi-turn judge
frustration_judge = UserFrustration().register(name="frustration")
frustration_judge = frustration_judge.start(sampling_config=ScorerSamplingConfig(sample_rate=0.3))
View results
After scheduling scorers, allow 15-20 minutes for initial processing. Then:
- Navigate to your MLflow experiment.
- Open the Traces tab to see assessments attached to traces.
- Use the monitoring dashboards to track quality trends.
For multi-turn judges, assessments are attached to the first trace in each session. See How assessments are stored for details.
Best practices
Sampling strategy
-
For critical scorers such as safety and security checks, use
sample_rate=1.0. -
For expensive scorers, such as complex LLM judges, use lower sample rates (0.05-0.2).
-
For iterative improvement during development, use moderate rates (0.3-0.5).
-
Balance coverage with cost, as shown in the following examples:
Python# High-priority scorers: higher sampling
safety_judge = Safety().register(name="safety")
safety_judge = safety_judge.start(sampling_config=ScorerSamplingConfig(sample_rate=1.0)) # 100% coverage for critical safety
# Expensive scorers: lower sampling
complex_scorer = ComplexCustomScorer().register(name="complex_analysis")
complex_scorer = complex_scorer.start(sampling_config=ScorerSamplingConfig(sample_rate=0.05)) # 5% for expensive operations
Filter traces
Use the filter_string parameter in ScorerSamplingConfig to control which traces a scorer evaluates. This uses the same filter syntax as mlflow.search_traces().
from mlflow.genai.scorers import Safety, ScorerSamplingConfig

# Only evaluate traces that completed successfully
safety_judge = Safety().register(name="safety")
safety_judge = safety_judge.start(
    sampling_config=ScorerSamplingConfig(
        sample_rate=1.0,
        filter_string="attributes.status = 'OK'"
    ),
)
You can combine multiple conditions:
import time

# Evaluate successful traces from the last 24 hours
one_day_ago = int((time.time() - 86400) * 1000)
safety_judge = safety_judge.start(
    sampling_config=ScorerSamplingConfig(
        sample_rate=0.5,
        filter_string=f"attributes.status = 'OK' AND attributes.timestamp_ms > {one_day_ago}"
    ),
)
Custom scorer design
Keep custom scorers self-contained, as shown in the following example:
@scorer
def well_designed_scorer(inputs, outputs):
    # All imports inside the function
    import re
    import json

    # Handle missing data gracefully
    response = outputs.get("response", "")
    if not response:
        return 0.0

    # Return consistent types
    return float(len(response) > 100)
Troubleshooting
Scorers not running
If scorers aren't executing, check the following:
- Check experiment: Ensure that traces are logged to the experiment, not to individual runs.
- Sampling rate: With low sample rates, it might take time to see results.
- Verify filter string: Ensure your
filter_stringmatches actual traces.
Serialization issues
Custom scorers for production monitoring are serialized so they can be executed remotely by the monitoring service. This imposes several constraints:
- Notebook requirement: Custom
@scorerfunctions must be defined and registered from a Databricks notebook. The serialization mechanism relies on the notebook environment. - Self-contained functions: All imports must be inline within the function body. References to external variables, modules, or objects defined outside the function are not captured during serialization.
- No class-based scorers: Only
@scorerdecorator-based scorers can be registered. Class-basedScorersubclasses cannot be serialized for remote execution. - No type hints requiring imports: Type hints in the function signature that require import statements (for example,
Listfromtyping) cause serialization failures.
When you create a custom scorer, include imports in the function definition.
# Avoid external dependencies
import external_library  # Outside function

@scorer
def bad_scorer(outputs):
    return external_library.process(outputs)

# Include imports in the function definition
@scorer
def good_scorer(outputs):
    import json  # Inside function
    return len(json.dumps(outputs))

# Avoid using type hints in scorer function signature that requires imports
from typing import List

@scorer
def scorer_with_bad_types(outputs: List[str]):
    return False

# Class-based scorers are not supported for production monitoring
class MyScorer(Scorer):
    name: str = "my_scorer"
    def __call__(self, outputs):
        return len(outputs) > 10
Next steps
- Manage production scorers - Manage the lifecycle of your production scorers.
- Backfill historical traces with scorers - Retroactively apply scorers to historical traces.
- Archive traces to a Delta table - Save traces and assessments to a Delta table.
- Code-based scorers - Build scorers tailored to your needs.
- Evaluate conversations - Learn about multi-turn conversation evaluation and multi-turn judges.
- Building MLflow evaluation datasets - Use monitoring results to improve quality.
Reference guides
- Scorer lifecycle management API reference - API reference for scorer lifecycle management.
- Scorers and LLM judges - Understand the metrics that power monitoring.
- Evaluate GenAI during development - How offline evaluation relates to production.