
Unity Catalog metric views
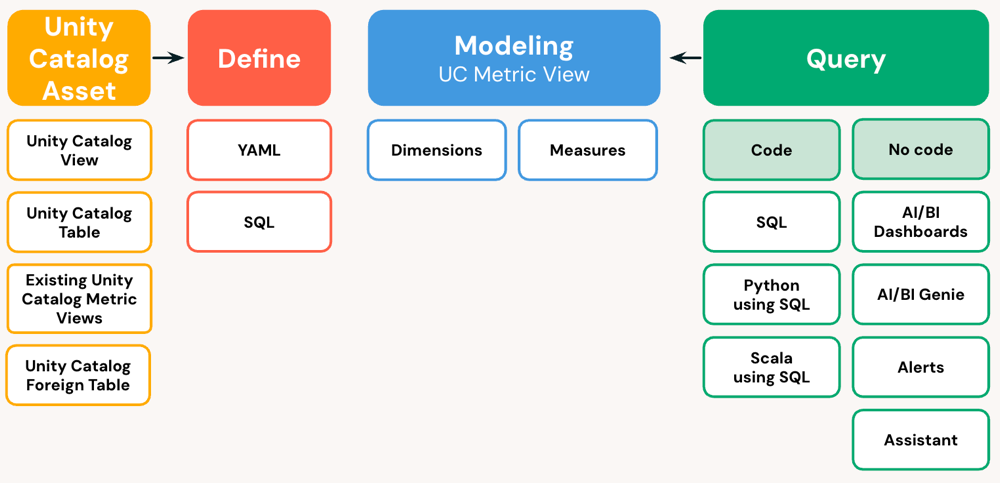
Preview

This feature is in Public Preview.

Metric views provide a centralized way to define and manage consistent, reusable, and governed core business metrics. This page explains metric views, how to define them, control access, and query them in downstream tools.

What is a metric view?

Metric views abstract complex business logic into a centralized definition, enabling organizations to define key performance indicators once and use them consistently across reporting tools like dashboards, Genie spaces, and alerts. Metric views are defined in YAML format and registered in Unity Catalog. You can create them using SQL or the Catalog Explorer UI. Like any other table or view, metric views can be queried using SQL.

Diagram showing that metric views are defined on source tables, views, and queries and consumed from code and no code interfaces.

A metric view specifies a set of metric definitions, which include dimensions and measures, based on a data source, or multiple sources if join logic is used. The source in the metric view definition can be a view, table, or SQL query. Joins are only supported on views and tables.

A dimension is a categorical attribute that organizes and filters data, such as product names, customer types, or regions. Dimensions provide the labels and groupings needed to analyze measures effectively.

A measure is a value that summarizes business activity, typically using an aggregate function such as SUM() or AVG(). Measures are defined independently of dimensions, allowing users to aggregate them across any dimension at runtime. For example, defining a total_revenue measure enables aggregation by customer, supplier, or region. Measures are commonly used as KPIs in reports and dashboards.

The following code block shows an example of how measures and dimensions are defined in a metric view:

YAML
version: 0.1

source: samples.tpch.orders
filter: o_orderdate > '1990-01-01'

dimensions:
- name: Order Month
expr: DATE_TRUNC('MONTH', o_orderdate)

- name: Order Status
expr: CASE
WHEN o_orderstatus = 'O' then 'Open'
WHEN o_orderstatus = 'P' then 'Processing'
WHEN o_orderstatus = 'F' then 'Fulfilled'
END

- name: Order Priority
expr: SPLIT(o_orderpriority, '-')[1]

measures:
- name: Order Count
expr: COUNT(1)

- name: Total Revenue
expr: SUM(o_totalprice)

- name: Total Revenue per Customer
expr: SUM(o_totalprice) / COUNT(DISTINCT o_custkey)

- name: Total Revenue for Open Orders
expr: SUM(o_totalprice) FILTER (WHERE o_orderstatus='O')

Metric views compared to standard views

Standard views are typically designed to answer a specific business question. They often include aggregation logic and dimension groupings that must be specified when the view is created. This can cause issues when a user wants to query a dimension not included in the original view. More complex measures, such as ratios or distinct counts, often cannot be re-aggregated without returning incorrect results.

Metric views allow authors to define measures and dimensions independently of how users filter and group the data. This separation allows the system to generate the correct query based on the user’s selection, while preserving consistent, centralized metric logic.

Example

Suppose you want to analyze revenue per distinct customer across different geographic levels. With a standard view, you would need to create separate views for each grouping, such as by state, region, or country, or compute all combinations in advance using GROUP BY CUBE() and filter afterward. These workarounds increase complexity and can lead to performance and governance issues.

With a metric view, you define the metric only once, and it can be grouped by different dimensions when queried. For example, sum of revenue divided by the distinct customer count. Then, users can group by any available geography dimension. The query engine rewrites the query behind the scenes to perform the correct computation, regardless of how the data is grouped.

Use cases for metric views

Metric views are beneficial when:

  • You need to standardize metric definitions across teams and tools.
  • You want to expose metrics that cannot be safely re-aggregated, such as ratios or distinct counts.
  • You want to enable flexible slicing and filtering for business users, while maintaining transparency and governance through SQL.

This approach helps prevent inconsistencies, reduces duplication, and simplifies the user experience when working with business metrics across the organization.

Define a metric view

Users with the CREATE TABLE privilege on a schema can create metric views. You must have at least SELECT privileges on the source objects. You can create metric views using the YAML editor in the Catalog Explorer UI or using SQL.

The YAML definition for a metric view includes six top-level fields:

  • version: Defaults to 0.1. This is the version of the metric view specification.
  • source: The source data for the metric view. This can be a table-like asset or a SQL query.
  • joins: Optional. Used to LEFT JOIN the fact table defined under source with dimension tables as a star schema model.
  • filter: Optional. A SQL boolean expression that applies to all queries; equivalent to the WHERE clause.
  • dimensions: An array of dimension definitions, including the dimension name and expression.
  • measures: An array of aggregate expression columns.

Metric views are composable, allowing you to build layered, reusable logic in a single view. Dimensions can reference previously defined dimensions, and measures can reference any dimension or previously defined measures. When defining new dimensions or measures, you can also reference columns from joins defined in the metric view.

The following example explains how to create a metric view using the Databricks UI. See CREATE VIEW for information about defining metric views using SQL.

For a complete example that shows how to create a metric view, see Create a metric view.

View or edit a metric view

Anyone with SELECT privileges on the metric view can view the detailed YAML definition. You can edit the definition if you are the metric view owner. To view details or edit an existing metric view:

  1. Click Catalog icon Catalog in the sidebar.
  2. Click the name of the metric view that you want to review.
  3. Click Edit to open the YAML editor.

See Metric view YAML reference. See ALTER VIEW for information about editing a metric view using SQL.

Manage metric view permissions

Metric views are a Unity Catalog securable object and follow the same permissions model as other views. See Unity Catalog privileges and securable objects.

Consume metric views

You can query metric views in the same way as a standard view. Run queries from any SQL editor that is attached to a SQL warehouse or other compute resource running Databricks Runtime 16.4 or above. All measure evaluations in a metric view query must use the MEASURE aggregate function.

For complete details and syntax, see measure aggregate function.

You can also use metric views throughout the Databricks workspace. For more information, see the associated documentation:

Limitations

The following limitations apply to metric views:

  • Metric views do not support lineage.
  • Metric views do not support Delta Sharing.
  • Lakehouse Monitoring is not supported.
  • JOINs at query time are not supported. Use CTEs to join data sources.
  • SELECT * is not supported.
  • A measure cannot be re-aggregated. For example, expressions like SUM(MEASURE(measure_name)) are not supported. Apply aggregations only to base fields, not aggregated measures.
  • Joined tables cannot include MAP type columns.
  • You cannot combine a windowed measure and an aggregated base field in a MEASURE expression.