Databricks Autologging
This page covers how to customize Databricks Autologging, which automatically captures model parameters, metrics, files, and lineage information when you train models from a variety of popular machine learning libraries. Training sessions are recorded as MLflow tracking runs. Model files are also tracked so you can easily log them to the MLflow Model Registry.
To enable trace logging for generative AI workloads, MLflow supports OpenAI autologging.
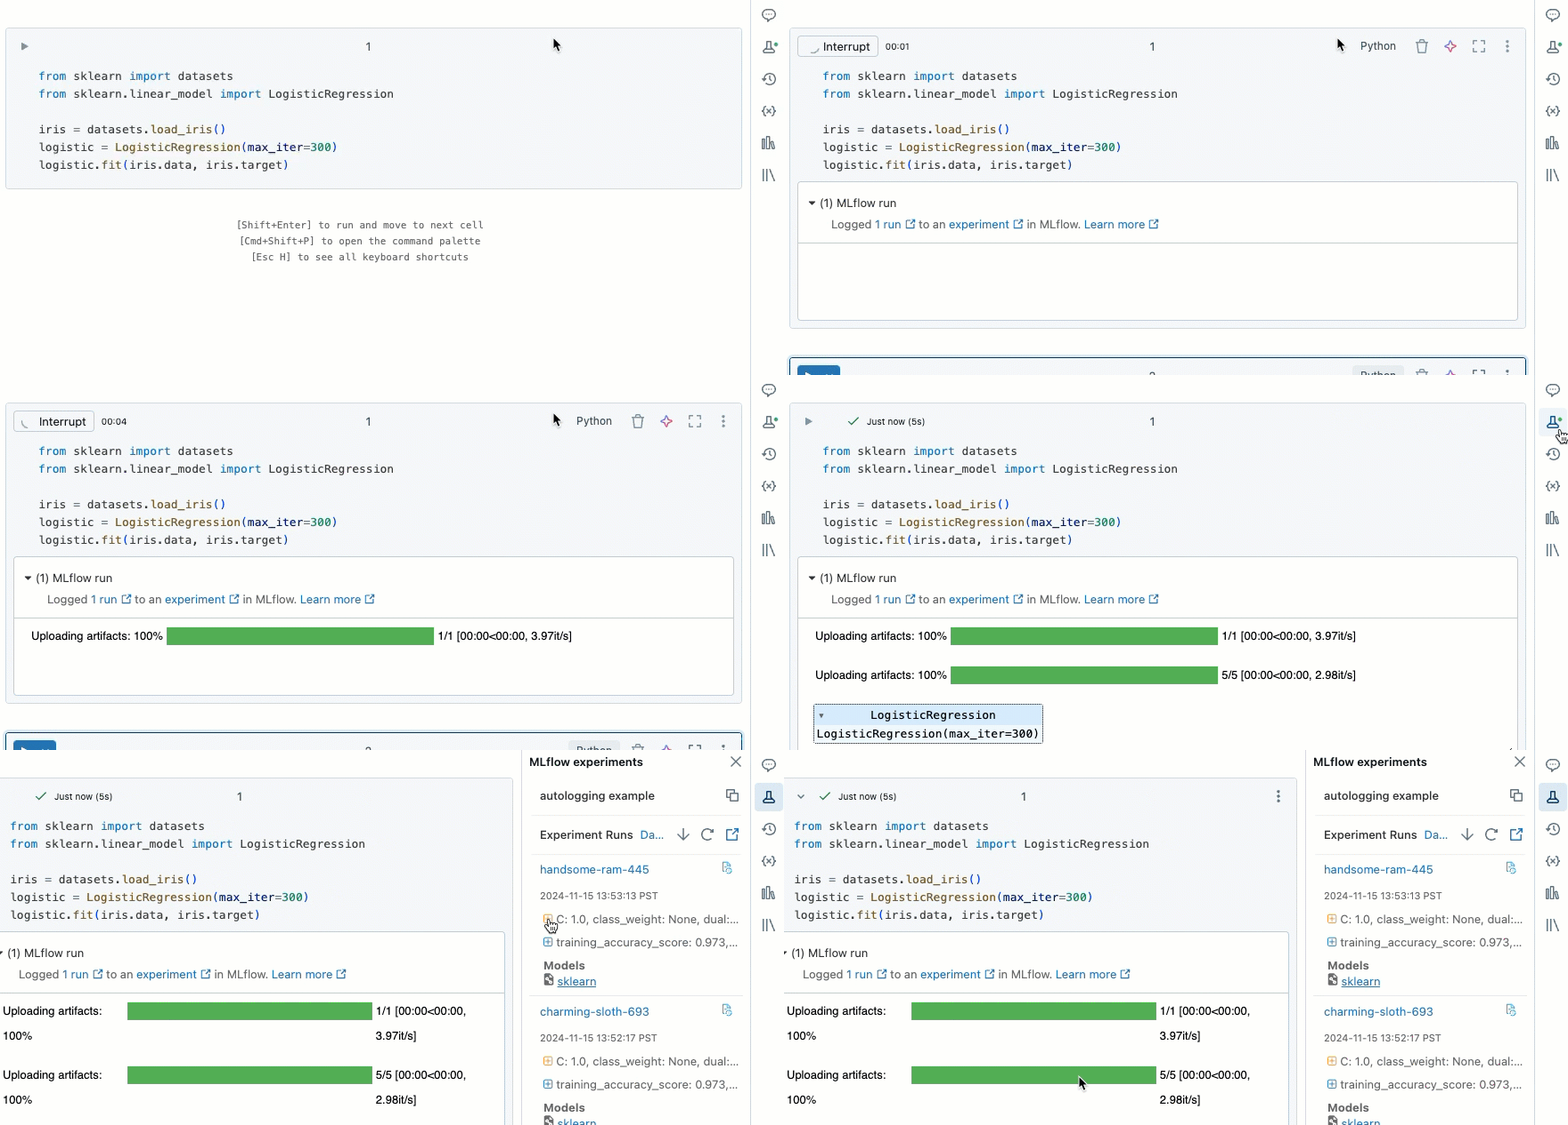
The following video shows Databricks Autologging with a scikit-learn model training session in an interactive Python notebook. Tracking information is automatically captured and displayed in the Experiment Runs sidebar and in the MLflow UI.

Requirements
- Databricks Autologging is generally available in all regions with Databricks Runtime 10.4 LTS ML or above.
- Databricks Autologging is available in select preview regions with Databricks Runtime 9.1 LTS ML or above.
How it works
When you attach an interactive Python notebook to a Databricks cluster, Databricks Autologging calls mlflow.autolog() to set up tracking for your model training sessions. When you train models in the notebook, model training information is automatically tracked with MLflow Tracking. For information about how this model training information is secured and managed, see Security and data management.
Autologging is not automatically enabled on serverless compute. For serverless compute clusters, you must explicitly call mlflow.autolog() to enable autologging functionality.
The default configuration for the mlflow.autolog() call is:
mlflow.autolog(
    log_input_examples=False,
    log_model_signatures=True,
    log_models=True,
    disable=False,
    exclusive=False,
    disable_for_unsupported_versions=True,
    silent=False
)
You can customize the autologging configuration.
Usage
To use Databricks Autologging, train a machine learning model in a supported framework using an interactive Databricks Python notebook. Databricks Autologging automatically records model lineage information, parameters, and metrics to MLflow Tracking. You can also customize the behavior of Databricks Autologging.
Databricks Autologging is not applied to runs created using the
MLflow fluent API with
mlflow.start_run(). In these cases, you must call mlflow.autolog() to save autologged content
to the MLflow run. See Track additional content.
Customize logging behavior
To customize logging, use mlflow.autolog().
This function provides configuration parameters to enable model logging (log_models), log datasets (log_datasets),
collect input examples (log_input_examples), log model signatures (log_model_signatures), configure warnings (silent), and more.
Track additional content
To track additional metrics, parameters, files, and metadata with MLflow runs created by Databricks Autologging, follow these steps in a Databricks interactive Python notebook:
- Call mlflow.autolog()
with
exclusive=False. - Start an MLflow run using mlflow.start_run().
You can wrap this call in
with mlflow.start_run(); when you do this, the run is ended automatically after it completes. - Use MLflow Tracking methods, such as mlflow.log_param(), to track pre-training content.
- Train one or more machine learning models in a framework supported by Databricks Autologging.
- Use MLflow Tracking methods, such as mlflow.log_metric(), to track post-training content.
- If you did not use
with mlflow.start_run()in Step 2, end the MLflow run using mlflow.end_run().
For example:
import mlflow
mlflow.autolog(exclusive=False)

with mlflow.start_run():
  mlflow.log_param("example_param", "example_value")
  # <your model training code here>
  mlflow.log_metric("example_metric", 5)
Disable Databricks Autologging
To disable Databricks Autologging in a Databricks interactive Python notebook, call
mlflow.autolog() with
disable=True:
import mlflow
mlflow.autolog(disable=True)
Administrators can also disable Databricks Autologging for all clusters in a workspace from the Advanced tab of the admin settings page. Clusters must be restarted for this change to take effect.
Supported environments and frameworks
Databricks Autologging is supported in interactive Python notebooks and is available for the following ML frameworks:
- scikit-learn
- Apache Spark MLlib
- TensorFlow
- Keras
- PyTorch Lightning
- XGBoost
- LightGBM
- Gluon
- Fast.ai
- statsmodels
- PaddlePaddle
- OpenAI
- LangChain
For more information about each of the supported frameworks, see MLflow automatic logging.
MLflow Tracing enablement
MLflow Tracing utilizes the autolog feature within respective model framework integrations to control
the enabling or disabling of tracing support for integrations that support tracing.
For example, to enable tracing when using a LlamaIndex model, utilize
mlflow.llama_index.autolog()
with log_traces=True:
import mlflow
mlflow.llama_index.autolog(log_traces=True)
For serverless compute clusters, autologging for tracing is not automatically enabled. You must explicitly enable autologging for the specific framework integrations you want to trace (for example, mlflow.openai.autolog() or mlflow.langchain.autolog()).
The supported integrations that have trace enablement within their autolog implementations are:
Security and data management
All model training information tracked with Databricks Autologging is stored in MLflow Tracking and is secured by MLflow Experiment permissions. You can share, modify, or delete model training information using the MLflow Tracking API or UI.
Administration
Administrators can enable or disable Databricks Autologging for all interactive notebook sessions across their workspace in the Advanced tab of the admin settings page. Changes do not take effect until the cluster is restarted.
Limitations
- Databricks Autologging is enabled only on the driver node of your Databricks cluster. To use autologging from worker nodes, you must explicitly call mlflow.autolog() from within the code executing on each worker.
- The XGBoost scikit-learn integration is not supported.
Apache Spark MLlib, Hyperopt, and automated MLflow tracking
Databricks Autologging does not change the behavior of existing automated MLflow tracking integrations for Apache Spark MLlib and Hyperopt.
In Databricks Runtime 10.1 ML, disabling the automated MLflow tracking integration for Apache Spark MLlib CrossValidator and TrainValidationSplit models also disables the Databricks Autologging feature for all Apache Spark MLlib models.