Dashboard settings
Dashboard-level settings provide global control over the following aspects of your dashboard:
- Theme customization: Control the visual appearance, including colors, fonts, widget styling, and layout preferences
- General settings: Add tags (Public Preview), set a locale to control formatting standards, and control the availability of the associated Genie Agent.
- Custom thumbnail: Upload a custom thumbnail image for the dashboard.
These settings apply to all widgets and visualizations within a dashboard, ensuring a consistent user experience. When you modify dashboard settings, changes are automatically applied to existing widgets and are used as defaults for any new widgets you add.
Dashboard settings are only accessible from draft dashboards.
This page explains how to customize dashboard settings and themes to match your organization's branding, improve readability, and ensure consistent data presentation across different regions and languages.
Access dashboard settings
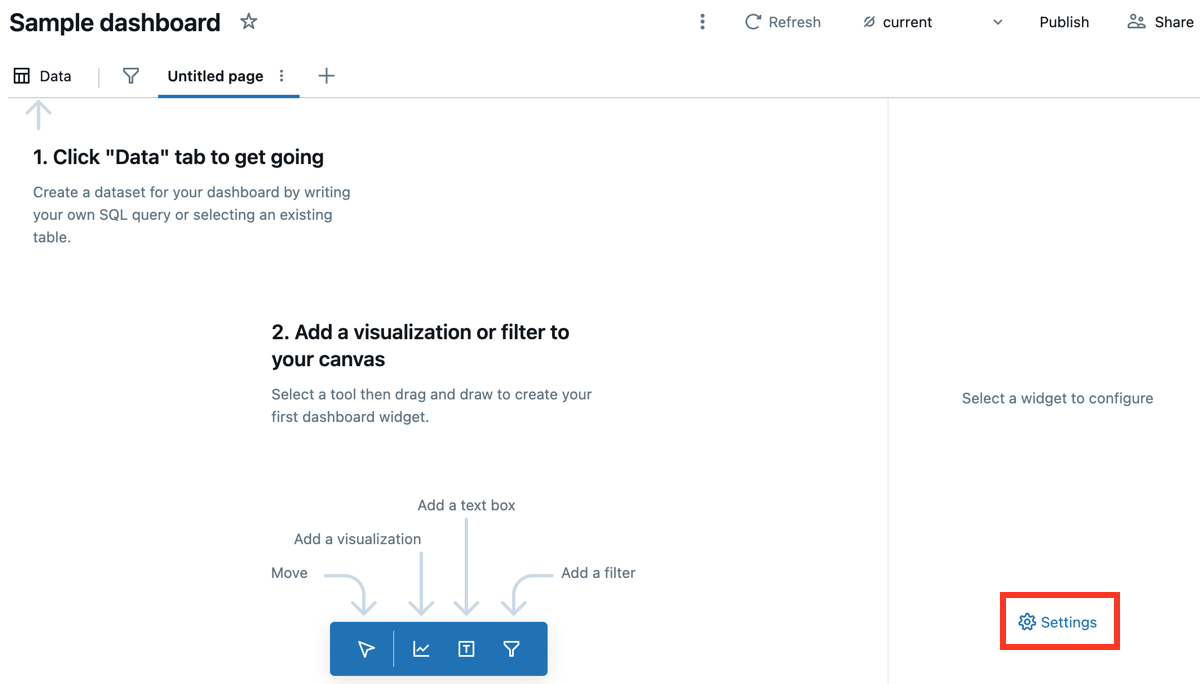
To open dashboard settings:
- Open your draft dashboard.
- In the right panel, click Settings. This option appears when no widgets are selected.
Theme settings
You can customize the theme by selecting a workspace or preset from the drop-down menu or by adjusting individual settings to create a custom color palette and appearance.
Apply a workspace theme
Workspace themes provide a centralized way to apply consistent colors, fonts, and visual styling across your AI/BI dashboards. All new dashboards automatically inherit the workspace theme. If your workspace admin has configured a workspace theme, you can apply it to your existing dashboard.
For information on workspace themes, see Manage AI/BI dashboard workspace themes.
Apply the workspace theme to an existing dashboard
To apply the workspace theme:
-
Open your draft dashboard.
-
Access dashboard settings.
-
Use the Theme drop-down menu to select Workspace theme.
-
Preview the theme in light and dark modes by clicking Light mode or Dark mode under the Theme section.
-
Click Publish.
When you apply the workspace theme, your dashboard receives a snapshot of the current theme configuration. The dashboard uses this snapshot even if the workspace admin later updates or deletes the workspace theme.
Choose a preset theme
To choose a dashboard theme:
- Access dashboard settings.
- Use the Theme drop-down menu to choose a preset theme.
You can preview how your theme will appear in light and dark modes by clicking Light mode or Dark mode under the Theme section.
Customize colors and fonts
The dashboard theme settings—including colors, fonts, title alignment, widget styling, and visualization palette—use the same options as the workspace theme editor. For descriptions of each setting, see Create or update the workspace theme.
General settings
Manage dashboard tags
This feature is in Public Preview.
Use tags to organize and categorize dashboards for easier management. Tags can be used for automation. For example, you can tag a dashboard as “Work in progress,” and an overnight process can automatically retrieve all dashboards with that tag using the API and assign them to the temporary warehouse until they’re tagged as “Certified.” For more information about tags, see Apply tags to Unity Catalog securable objects.
View tags
To view tags on a dashboard:
- Click the kebab menu
 near the upper-right corner of the dashboard.
 - Click Info.
Add tags
You must have at least CAN EDIT permissions on a dashboard to add a tag. To add a governed tag, you must also have the ASSIGN permission on the governed tag.
To add tags:
-
Open your draft dashboard.
-
In the right pane, click Settings.
-
Click General.
-
Under Tags, add or update a tag:
- If there are no tags, click the Add tags button.
- If there are tags, click the
 Add/Edit tags icon.
-
Select an existing tag Key and Value or enter a name of a new tag.
- Tags that are governed are in the Governed section header and have a lock icon
 .
. - Tag keys are required. Whether a tag value is required depends on the tag key.
- Tags that are governed are in the Governed section header and have a lock icon
Set a locale
You can customize number and date formatting by locale for all visualizations from the canvas of a draft dashboard.
To set a locale:
- Access dashboard settings.
- Click General.
- Use the drop-down menu to select your locale.
Configure filter application behavior
You can control when filters are applied to dashboard visualizations. By default, filters apply immediately when a viewer selects a value. You can configure filters to apply only when the viewer clicks an Apply button.
To configure filter application:
- Access dashboard settings.
- Click General.
- Under Apply filters, select one of the following options:
- Instantly: Filters apply as soon as a viewer selects a value from a dropdown.
- With Apply Button: Filters apply only when the viewer clicks the Apply button after making selections.
When With Apply Button is selected, viewers can choose multiple filter values before updating the dashboard. This reduces the number of query executions and improves performance for dashboards with multiple filters or large datasets. For more information about filters, see Use dashboard filters.
Enable Genie
You can enable Genie for your dashboard and configure how the Genie Agent is created. Genie is enabled by default.
To configure Genie:
- Access dashboard settings.
- Click General.
- Toggle Enable Genie on.
- Select one of the following options:
- Auto-generate Genie Agent (Preview): Automatically builds a Genie Agent using the published dashboard's context. This option is selected by default.
- Link existing Genie Agent: Links the dashboard to an existing Genie Agent. Paste the URL of the Genie Agent you want to link.
Custom thumbnail
Dashboard authors can upload a custom thumbnail image that appears in dashboard listing pages.
To set a custom thumbnail:
- Access dashboard settings.
- Under Custom thumbnail, drag and drop an image onto the upload area, or click Browse to select a file.