Debug and analyze your app with tracing
MLflow Tracing provides deep insights into your application's behavior, facilitating a complete debugging experience across different environments. By capturing the complete request-response cycle (Input/Output Tracking) and the execution flow, you can visualize and understand your application's logic and decision-making process.
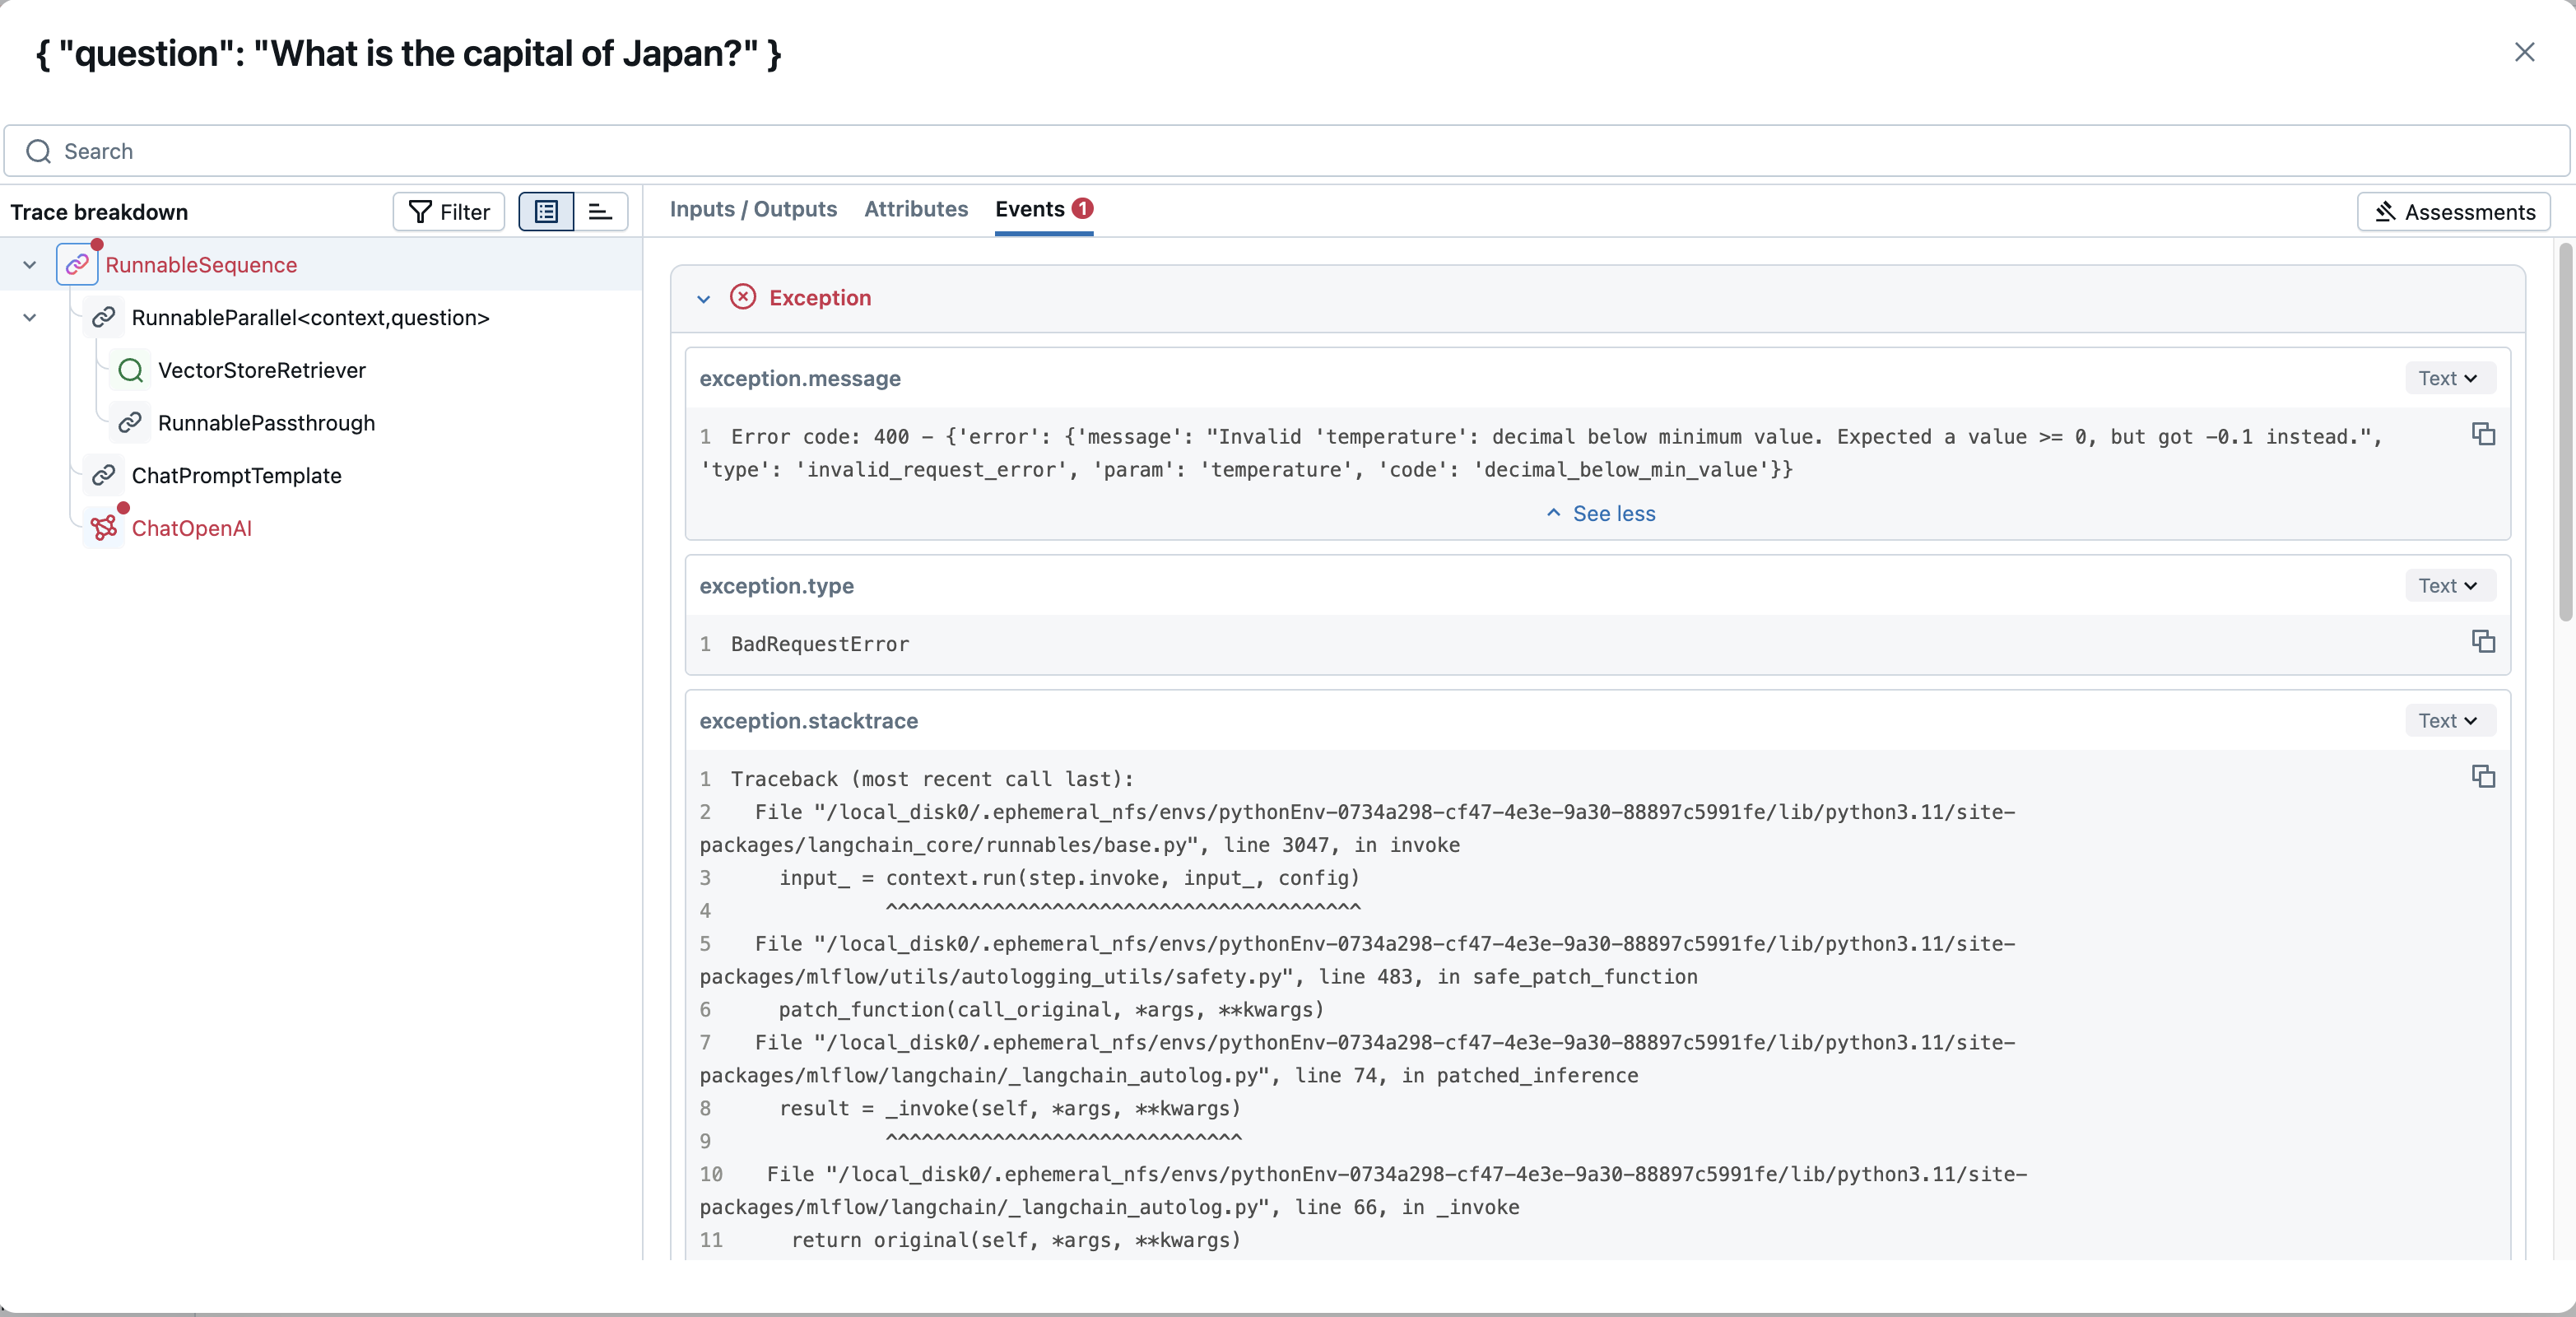
Examining the inputs, outputs, and metadata for each intermediate step (for example, retrieval, tool calls, LLM interactions) and associated user feedback or the results of quality evaluations allows you to:
- In Development: Get detailed visibility into what happens beneath the abstractions of GenAI libraries, helping you precisely identify where issues or unexpected behaviors occur.
- In Production: Monitor and debug issues in real-time. Traces capture errors and can include operational metrics like latency at each step, aiding in quick diagnostics.
MLflow Tracing offers a unified experience between development and production: you instrument your application once, and tracing works consistently in both environments. This allows you to navigate traces seamlessly within your preferred environment—be it your IDE, notebook, or production monitoring dashboard—eliminating the hassle of switching between multiple tools or searching through overwhelming logs.
Monitor performance and optimize costs
Understanding and optimizing the performance and cost of your GenAI applications is crucial. MLflow Tracing enables you to capture and monitor key operational metrics such as latency, cost, and resource utilization at each step of your application's execution.
This allows you to:
- Track and identify performance bottlenecks within complex pipelines.
- Monitor resource utilization to ensure efficient operation.
- Optimize cost efficiency by understanding where resources or tokens are consumed.
- Identify areas for performance improvement in your code or model interactions.
Furthermore, MLflow Tracing is compatible with OpenTelemetry, an industry-standard observability specification. This compatibility allows you to export your trace data to various services in your existing observability stack. See OpenTelemetry Export for more details.