Get started: MLflow Tracing for GenAI (Databricks Notebook)
This quickstart helps you integrate your GenAI app with MLflow Tracing if you use a Databricks notebook as your development environment. If you use a local IDE, please use the IDE quickstart instead.
By the end of this tutorial, you will have:
- A Databricks notebook with a linked MLflow experiment for your GenAI app
- A simple GenAI application instrumented with MLflow Tracing
- A trace from that app in your MLflow experiment
Environment setup
-
Create a new notebook in your Databricks workspace. The notebook will have a default MLflow experiment that is the container for your GenAI application. Learn more about MLflow experiments in the MLflow concepts section.
-
Install required packages:
mlflow[databricks]: Use the latest version of MLflow to get more features and improvements.openai: This tutorial will use the OpenAI API client to call Databricks-hosted models.
%pip install -qq --upgrade "mlflow[databricks]>=3.1.0" openai
dbutils.library.restartPython()
Step 1: Instrument your application with tracing
The code snippets below define a simple GenAI app that completes sentence templates using an LLM.
First, create an OpenAI client to connect to Databricks-hosted foundation models:
from databricks.sdk import WorkspaceClient

# Create an OpenAI client that is connected to Databricks-hosted LLMs
w = WorkspaceClient()
client = w.serving_endpoints.get_open_ai_client()

model_name = "databricks-claude-sonnet-4"
Alternatively, you could use the OpenAI SDK to connect to OpenAI-hosted models:
import openai

# Ensure your OPENAI_API_KEY is set in your environment
# os.environ["OPENAI_API_KEY"] = "<YOUR_API_KEY>" # Uncomment and set if not globally configured

client = openai.OpenAI()

model_name = "gpt-4o-mini"
Second, define and run your application. Instrumenting the app with tracing simply uses:
mlflow.openai.autolog(): Automatic instrumentation to capture the details of the call to the OpenAI SDK@mlflow.trace: Decorator that makes it easy to trace any Python function
import mlflow
import os

# Enable auto-tracing for OpenAI
mlflow.openai.autolog()

# Set up MLflow tracking to Databricks
mlflow.set_tracking_uri("databricks")
mlflow.set_experiment("/Shared/openai-tracing-demo")

# Use the trace decorator to capture the application's entry point
@mlflow.trace
def my_app(input: str):
  # This call is automatically instrumented by `mlflow.openai.autolog()`
  response = client.chat.completions.create(
    model=model_name,
    temperature=0.1,
    max_tokens=200,
    messages=[
      {
        "role": "system",
        "content": "You are a helpful assistant.",
      },
      {
        "role": "user",
        "content": input,
      },
    ]
  )
  return response.choices[0].message.content

result = my_app(input="What is MLflow?")
print(result)
For details on adding tracing to apps, see the tracing instrumentation guide and the 20+ library integrations.
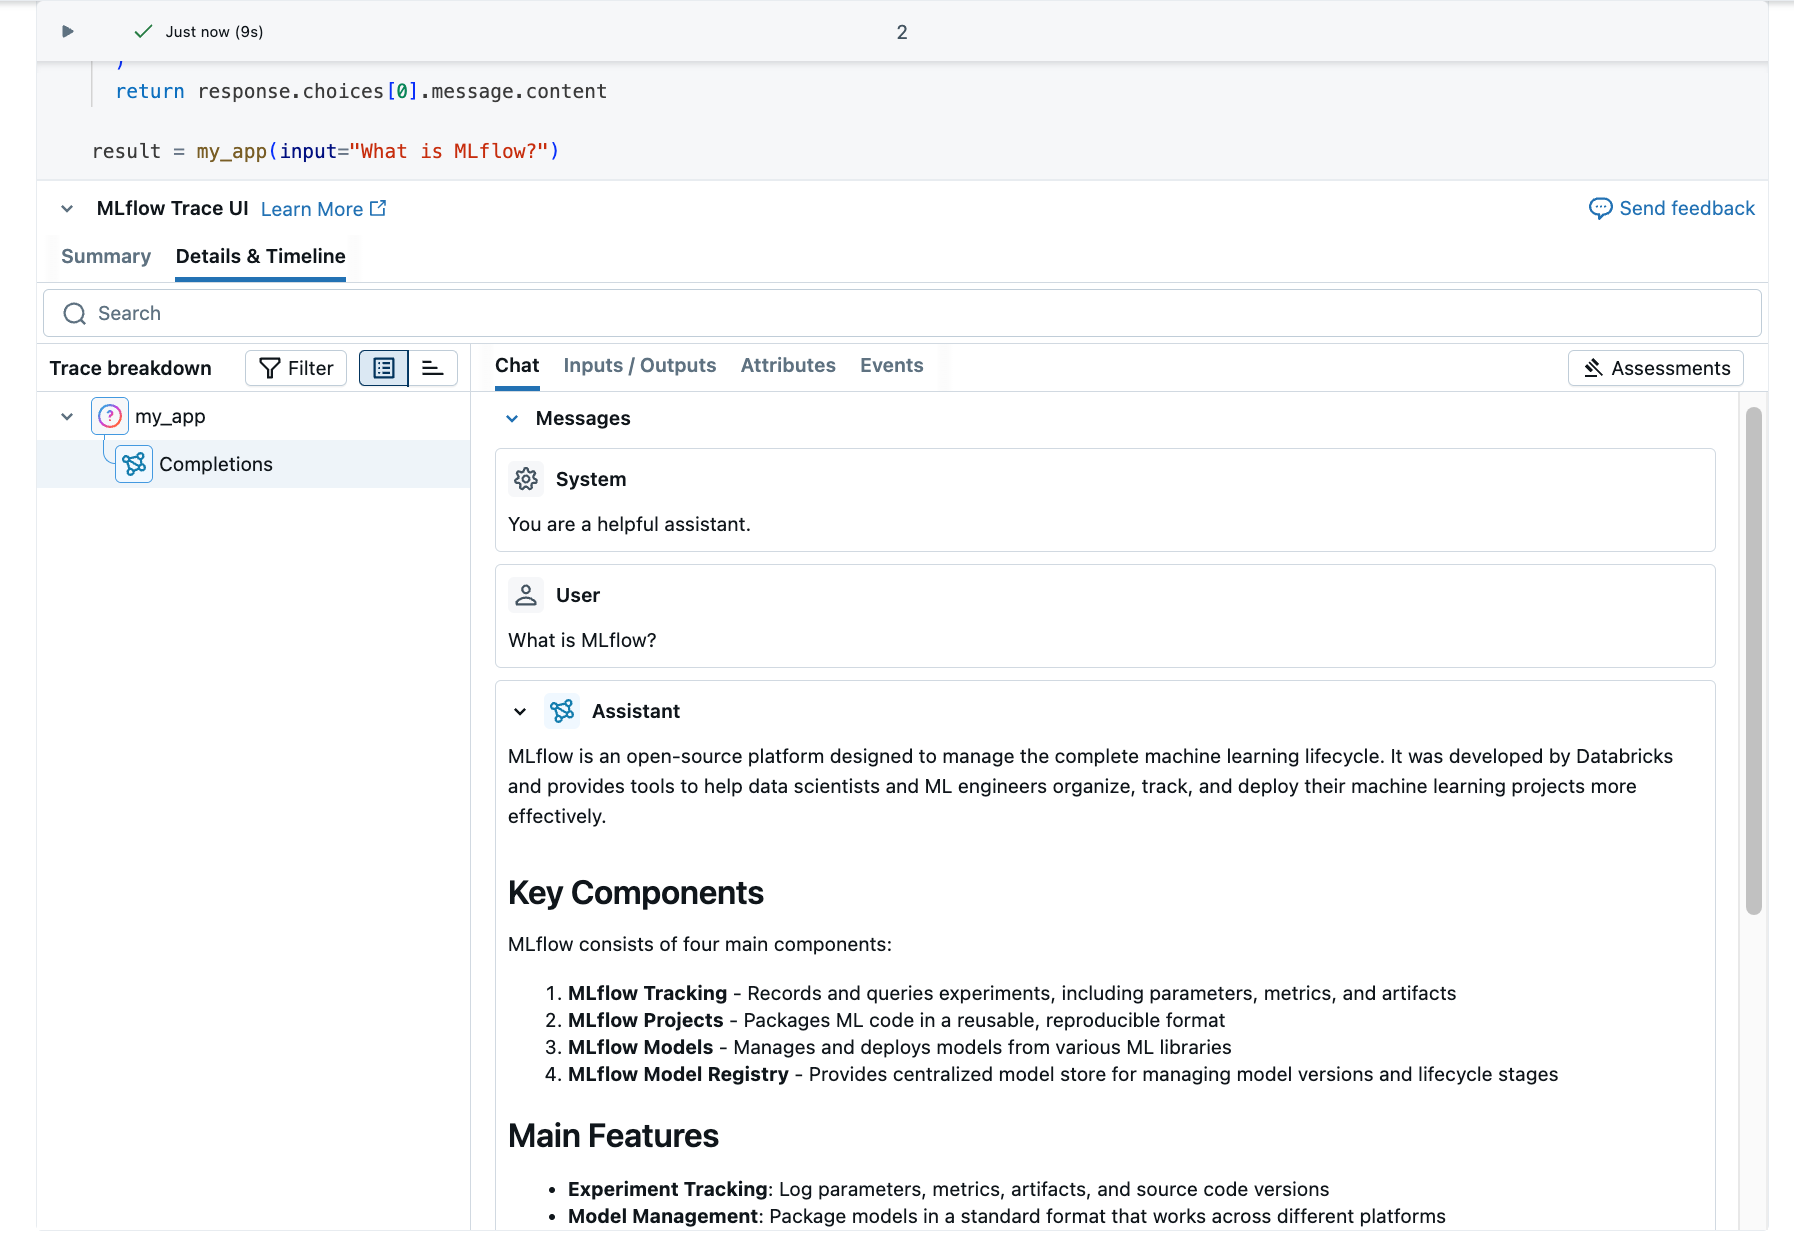
Step 2: View the trace in MLflow
The trace will appear below the notebook cell.
Optionally, you can go to the MLflow experiment UI to see the trace:
- Click the experiments icon
 on the right sidebar.
 - Click the open icon
 next to experiment runs.
 - The generated trace appears in the Traces tab.
- Click the trace to view its details.
Understand the trace
The trace you just created shows:
- Root span: Represents the inputs to the
my_app(...)function- Child span: Represents the OpenAI completion request
- Attributes: Contains metadata like model name, token counts, and timing information
- Inputs: The messages sent to the model
- Outputs: The response received from the model
This simple trace already provides valuable insights into your application's behavior, such as:
- What was asked
- What response was generated
- How long the request took
- How many tokens were used (affecting cost)
For more complex applications like RAG systems or multi-step agents, MLflow Tracing provides even more value by revealing the inner workings of each component and step.
Next steps
- MLflow Tracing guide - Start here for more in-depth learning about MLflow Tracing
- MLflow Tracing integrations - 20+ libraries with automatic tracing integrations
- Tracing concepts - Understand the fundamentals of MLflow Tracing