Pythonでパイプラインコードを開発する
Lakeflow Spark宣言型パイプライン (SDP) では、パイプラインでマテリアライズドビューとストリーミング テーブルを定義するためのいくつかの新しいPythonコード構造が導入されています。 パイプライン開発のためのPythonサポートは、 PySpark DataFrameと構造化ストリーミングAPIsの基本に基づいて構築されています。
Python と DataFrames に慣れていないユーザーの場合、Databricks では SQL インターフェイスの使用を推奨しています。SQLを使用したLakeFlow Spark宣言型パイプライン コードの開発を参照してください。
Lakeflow SDP Python構文の完全なリファレンスについては、 Lakeflow Spark宣言型パイプラインPython言語リファレンス」を参照してください。
パイプライン開発のためのPythonの基礎
パイプライン データセットを作成する Python コードは、DataFrames を返す必要があります。
すべてのLakeflow Spark宣言型パイプラインPython APIs 、 pyspark.pipelinesモジュールに実装されています。 Python で実装されたパイプライン コードでは、Python ソースの先頭にpipelinesモジュールを明示的にインポートする必要があります。この例では、次のインポート コマンドを使用し、例のdpを使用してpipelinesを参照します。
from pyspark import pipelines as dp
Apache Spark™には、 Spark 4.1 以降の 宣言型パイプライン が含まれており、 pyspark.pipelinesモジュールを通じて利用できます。 Databricks Runtime追加のAPIsと統合を使用してこれらのオープン ソース機能を拡張し、管理された本番運用で使用できるようにします。
オープンソースのpipelinesモジュールで記述されたコードは、変更せずに Databricks で実行されます。次の機能は Apache Spark の一部ではありません。
dp.create_auto_cdc_flowdp.create_auto_cdc_from_snapshot_flow@dp.expect(...)
パイプラインは、パイプラインの構成中に指定されたカタログとスキーマに対して自動的に読み取りと書き込みを行います。 「ターゲット カタログとスキーマを設定する」を参照してください。
パイプライン固有のPythonコードは、1 つの重要な点で他のタイプのPythonコードと異なります。Python Pythonライン コードは、データセットを作成するためのデータの取り込みと変換を実行する関数を直接呼び出しません。 代わりに、SDP はパイプラインで構成されたすべてのソース コード ファイル内のdpモジュールのデコレータ関数を解釈し、データフロー グラフを構築します。
パイプラインの実行時に予期しない動作を回避するには、データセットを定義する関数に副作用をもたらす可能性のあるコードを含めないでください。詳細については、 Python リファレンスを参照してください。
Pythonでマテリアライズドビューまたはストリーミングテーブルを作成する
@dp.tableを使用して、ストリーミング読み取りの結果からストリーミング テーブルを作成します。 @dp.materialized_viewを使用して、バッチ読み取りの結果からマテリアライズドビューを作成します。
マテリアライズドビューとストリーミングテーブルの名前は関数名から推測されています。 次のコード例は、マテリアライズドビューとストリーミング テーブルを作成するための基本的な構文を示しています。
どちらの関数もsamplesカタログ内の同じテーブルを参照し、同じデコレータ関数を使用します。これらの例は、マテリアライズドビューとストリーミング テーブルの基本構文の唯一の違いが、 spark.readとspark.readStream使用であることを強調しています。
すべてのデータソースがストリーミング読み取りをサポートしているわけではありません。 一部のデータソースは常にストリーミング セマンティクスで処理する必要があります。
from pyspark import pipelines as dp

@dp.materialized_view()
def basic_mv():
  return spark.read.table("samples.nyctaxi.trips")

@dp.table()
def basic_st():
  return spark.readStream.table("samples.nyctaxi.trips")
オプションで、 @dp.tableデコレータのname引数を使用してテーブル名を指定できます。次の例は、マテリアライズドビューとストリーミング テーブルのこのパターンを示しています。
from pyspark import pipelines as dp

@dp.materialized_view(name = "trips_mv")
def basic_mv():
  return spark.read.table("samples.nyctaxi.trips")

@dp.table(name = "trips_st")
def basic_st():
  return spark.readStream.table("samples.nyctaxi.trips")
オブジェクトストレージからデータをロードする
パイプラインは、Databricks でサポートされているすべての形式からのデータの読み込みをサポートします。データ形式オプションを参照してください。
これらの例では、ワークスペースに自動的にマウントされる /databricks-datasets で使用可能なデータを使用します。 Databricks では、ボリューム パスまたはクラウド URI を使用して、クラウド オブジェクト ストレージに格納されているデータを参照することをお勧めします。 Unity Catalogボリュームとはを参照してください。
Databricks 、クラウド オブジェクト ストレージに保存されているデータに対して増分取り込みワークロードを構成する場合、 Auto Loaderとストリーミング テーブルを使用することをお勧めします。 「Auto Loader とは何ですか?」を参照してください。
次の例では、Auto Loaderを使用してJSONファイルからストリーミングテーブルを作成します。
from pyspark import pipelines as dp

@dp.table()
def ingestion_st():
  return (spark.readStream
    .format("cloudFiles")
    .option("cloudFiles.format", "json")
    .load("/databricks-datasets/retail-org/sales_orders")
  )
次の例では、バッチセマンティクスを使用して JSON ディレクトリを読み取り、マテリアライズドビューを作成します。
from pyspark import pipelines as dp

@dp.materialized_view()
def batch_mv():
  return spark.read.format("json").load("/databricks-datasets/retail-org/sales_orders")
エクスペクテーションでデータを検証
エクスペクテーションを使用して、データ品質の制約を設定および適用できます。 パイプラインのエクスペクテーションを使用してデータ品質を管理するを参照してください。
次のコードは、 @dp.expect_or_dropを使用して、データ取り込み中に null のレコードを削除するvalid_dataという名前の期待値を定義します。
from pyspark import pipelines as dp

@dp.table()
@dp.expect_or_drop("valid_date", "order_datetime IS NOT NULL AND length(order_datetime) > 0")
def orders_valid():
  return (spark.readStream
    .format("cloudFiles")
    .option("cloudFiles.format", "json")
    .load("/databricks-datasets/retail-org/sales_orders")
  )
パイプラインで定義されたマテリアライズドビューとストリーミングテーブルをクエリする
次の例では、4 つのデータセットを定義します。
- JSONデータをロードする
ordersという名前のストリーミング テーブル。 - CSVデータをロードする
customersという名前のマテリアライズドビュー。 ordersデータセットとcustomersデータセットのレコードを結合し、注文タイムスタンプを日付にキャストし、customer_id、order_number、state、order_dateの各フィールドを選択するcustomer_ordersという名前のマテリアライズドビュー- 各州の日次注文数を集計する
daily_orders_by_stateという名前のマテリアライズドビュー
パイプライン内のビューまたはテーブルをクエリする場合、カタログとスキーマを直接指定することも、パイプラインで構成されたデフォルトを使用することもできます。この例では、パイプラインに構成されたデフォルトのカタログとスキーマから、 orders 、 customers 、およびcustomer_ordersテーブルが書き込まれ、読み取られます。
レガシー公開モードは、 LIVEスキーマを使用して、パイプラインに定義されている他のマテリアライズドビューとストリーミング テーブルをクエリします。 新しいパイプラインでは、 LIVEスキーマ構文は暗黙的に無視されます。LIVE スキーマ (レガシー)を参照してください。
from pyspark import pipelines as dp
from pyspark.sql.functions import col

@dp.table()
@dp.expect_or_drop("valid_date", "order_datetime IS NOT NULL AND length(order_datetime) > 0")
def orders():
  return (spark.readStream
    .format("cloudFiles")
    .option("cloudFiles.format", "json")
    .load("/databricks-datasets/retail-org/sales_orders")
  )

@dp.materialized_view()
def customers():
    return spark.read.format("csv").option("header", True).load("/databricks-datasets/retail-org/customers")

@dp.materialized_view()
def customer_orders():
  return (spark.read.table("orders")
    .join(spark.read.table("customers"), "customer_id")
      .select("customer_id",
        "order_number",
        "state",
        col("order_datetime").cast("int").cast("timestamp").cast("date").alias("order_date"),
      )
  )

@dp.materialized_view()
def daily_orders_by_state():
    return (spark.read.table("customer_orders")
      .groupBy("state", "order_date")
      .count().withColumnRenamed("count", "order_count")
    )
forループでテーブルを作成する
Python forループを使用して、プログラムで複数のテーブルを作成できます。これは、ほんのわずかしか変化しないデータ ソースまたはターゲット データセットが多数あり、その結果、維持するコードの総量が減り、コードの冗長性が少なくなる場合に便利です。
forループはロジックを順番に評価しますが、データセットの計画が完了すると、パイプラインはロジックを並列に実行します。
このパターンを使用してデータセットを定義する場合は、 forループに渡される値のリストが常に追加的であることを確認してください。パイプラインで以前に定義されたデータセットが将来のパイプライン実行から省略された場合、そのデータセットはターゲット スキーマから自動的に削除されます。
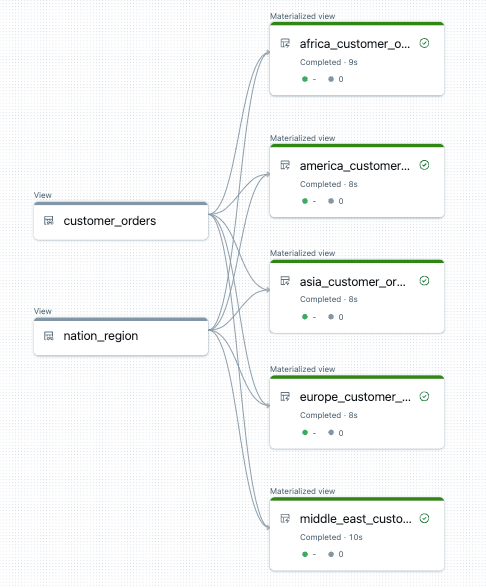
次の例では、顧客注文を地域別にフィルターする 5 つのテーブルを作成します。ここで、リージョン名は、ターゲットのマテリアライズドビューの名前を設定し、ソース データをフィルタリングするために使用されます。 一時ビューは、最終的なマテリアライズドビューの構築に使用されるソース テーブルからの結合を定義するために使用されます。
from pyspark import pipelines as dp
from pyspark.sql.functions import collect_list, col

@dp.temporary_view()
def customer_orders():
  orders = spark.read.table("samples.tpch.orders")
  customer = spark.read.table("samples.tpch.customer")

  return (orders.join(customer, orders.o_custkey == customer.c_custkey)
    .select(
      col("c_custkey").alias("custkey"),
      col("c_name").alias("name"),
      col("c_nationkey").alias("nationkey"),
      col("c_phone").alias("phone"),
      col("o_orderkey").alias("orderkey"),
      col("o_orderstatus").alias("orderstatus"),
      col("o_totalprice").alias("totalprice"),
      col("o_orderdate").alias("orderdate"))
  )

@dp.temporary_view()
def nation_region():
  nation = spark.read.table("samples.tpch.nation")
  region = spark.read.table("samples.tpch.region")

  return (nation.join(region, nation.n_regionkey == region.r_regionkey)
    .select(
      col("n_name").alias("nation"),
      col("r_name").alias("region"),
      col("n_nationkey").alias("nationkey")
    )
  )

# Extract region names from region table

region_list = spark.read.table("samples.tpch.region").select(collect_list("r_name")).collect()[0][0]

# Iterate through region names to create new region-specific materialized views

for region in region_list:

  @dp.materialized_view(name=f"{region.lower().replace(' ', '_')}_customer_orders")
  def regional_customer_orders(region_filter=region):

    customer_orders = spark.read.table("customer_orders")
    nation_region = spark.read.table("nation_region")

    return (customer_orders.join(nation_region, customer_orders.nationkey == nation_region.nationkey)
      .select(
        col("custkey"),
        col("name"),
        col("phone"),
        col("nation"),
        col("region"),
        col("orderkey"),
        col("orderstatus"),
        col("totalprice"),
        col("orderdate")
      ).filter(f"region = '{region_filter}'")
    )
以下は、このパイプラインのデータ フロー グラフの例です。
トラブルシューティング: forループは同じ値を持つテーブルを多数作成します
パイプラインが Python コードを評価するのに使用する遅延実行モデルでは、 @dp.materialized_view()で装飾された関数が呼び出されたときにロジックが個々の値を直接参照する必要があります。
次の例は、 forループを使用してテーブルを定義する 2 つの正しい方法を示しています。どちらの例でも、 tablesリストの各テーブル名は、 @dp.materialized_view()で装飾された関数内で明示的に参照されます。
from pyspark import pipelines as dp

# Create a parent function to set local variables

def create_table(table_name):
  @dp.materialized_view(name=table_name)
  def t():
    return spark.read.table(table_name)

tables = ["t1", "t2", "t3"]
for t_name in tables:
  create_table(t_name)

# Call `@dp.materialized_view()` within a for loop and pass values as variables

tables = ["t1", "t2", "t3"]
for t_name in tables:

  @dp.materialized_view(name=t_name)
  def create_table(table_name=t_name):
    return spark.read.table(table_name)
次の例では、値を正しく 参照していません 。 この例では、異なる名前のテーブルを作成しますが、すべてのテーブルは for ループの最後の値からデータを読み込みます。
from pyspark import pipelines as dp

# Don't do this!

tables = ["t1", "t2", "t3"]
for t_name in tables:

  @dp.materialized(name=t_name)
  def create_table():
    return spark.read.table(t_name)
マテリアライズドビューまたはストリーミングテーブルからレコードを完全に削除する
GDPRコンプライアンスなどの場合、削除を有効にしてマテリアライズドビューまたはストリーミング テーブルからレコードを永久に削除するには、オブジェクトの基礎となるDeltaテーブルに対して追加の操作を実行する必要があります。 マテリアライズドビューからレコードを確実に削除するには、 「削除を有効にしてマテリアライズドビューからレコードを完全に削除する」を参照してください。 ストリーミング テーブルからレコードを確実に削除するには、 「ストリーミング テーブルからレコードを完全に削除する」を参照してください。