View data quality monitoring expenses
To check data quality monitoring expenses, query the system table system.billing.usage. For more information on querying billing records, see Billable usage system table reference.
Anomaly detection expenses
To view only anomaly detection expenses, use the filter usage_metadata.schema_id is NOT NULL. The billing_origin_product is DATA_QUALITY_MONITORING.
Anomaly detection is enabled at the schema level, so checking for a non-null schema_id identifies costs related to anomaly detection.
SELECT usage_date, sum(usage_quantity) as dbus
FROM system.billing.usage
WHERE
  usage_date >= DATE_SUB(current_date(), 30) AND
  billing_origin_product = "DATA_QUALITY_MONITORING" AND
  usage_metadata.schema_id is NOT NULL
GROUP BY usage_date
ORDER BY usage_date DESC
To view only costs attributed to a specific schema:
SELECT usage_date, sum(usage_quantity) as dbus
FROM system.billing.usage
WHERE
  usage_date >= DATE_SUB(current_date(), 30) AND
  billing_origin_product = "DATA_QUALITY_MONITORING" AND
  usage_metadata.schema_id = "<schema_id>"
GROUP BY usage_date
ORDER BY usage_date DESC
Data profiling expenses
To check expenses, use a query or the billing portal.
View usage from the system table system.billing.usage
To view only data profiling expenses, use the filter usage_metadata.table_id is NOT NULL. Data profiling is enabled at the table level, so checking for a non-null table_id identifies costs related to data profiling.
For results created starting in February 2026, the billing_origin_product is DATA_QUALITY_MONITORING.
SELECT usage_date, sum(usage_quantity) as dbus
FROM system.billing.usage
WHERE
  usage_date >= DATE_SUB(current_date(), 30) AND
  billing_origin_product = "DATA_QUALITY_MONITORING" AND
  usage_metadata.table_id is NOT NULL
GROUP BY usage_date
ORDER BY usage_date DESC
To view only costs attributed to a specific table:
SELECT usage_date, sum(usage_quantity) as dbus
FROM system.billing.usage
WHERE
  usage_date >= DATE_SUB(current_date(), 30) AND
  billing_origin_product = "DATA_QUALITY_MONITORING" AND
  usage_metadata.table_id = "<table_id>"
GROUP BY usage_date
ORDER BY usage_date DESC
To query results created before February 2026:
SELECT usage_date, sum(usage_quantity) as dbus
FROM system.billing.usage
WHERE
  usage_date >= DATE_SUB(current_date(), 30) AND
  sku_name like "%JOBS_SERVERLESS%" AND
  custom_tags["LakehouseMonitoring"] = "true"
GROUP BY usage_date
ORDER BY usage_date DESC
View usage from the billing portal
You can also check data profiling expenses using the billing portal.
- Log in to the Databricks account console.
- In the sidebar, click the Usage icon.
- On the Usage page, select By tags.
- In the first drop-down menu, select LakehouseMonitoring as the tag key.
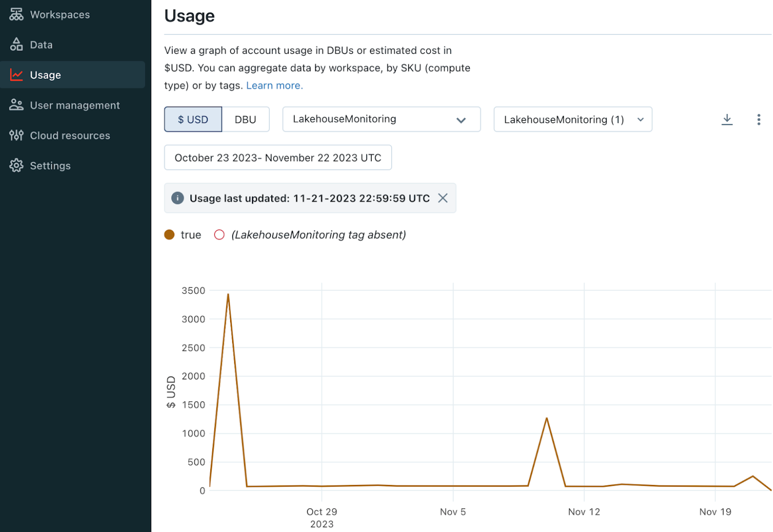
- In the second drop-down menu, select true as the tag value. After you do this, true appears in the UI as shown in the diagram, and the second drop-down menu shows
LakehouseMonitoring(1)to indicate that one tag key is selected.