Develop pipeline code with Python
Lakeflow Spark Declarative Pipelines (SDP) introduces several new Python code constructs for defining materialized views and streaming tables in pipelines. Python support for developing pipelines builds upon the basics of PySpark DataFrame and Structured Streaming APIs.
For users unfamiliar with Python and DataFrames, Databricks recommends using the SQL interface. See Develop Lakeflow Spark Declarative Pipelines code with SQL.
For a full reference of Lakeflow SDP Python syntax, see Lakeflow Spark Declarative Pipelines Python language reference.
Basics of Python for pipeline development
Python code that creates pipline datasets must return DataFrames.
All Lakeflow Spark Declarative Pipelines Python APIs are implemented in the pyspark.pipelines module. Your pipeline code implemented with Python must explicitly import the pipelines module at the top of Python source. In our examples, we use the following import command, and use dp in examples to refer to pipelines.
from pyspark import pipelines as dp
Apache Spark™ includes declarative pipelines beginning in Spark 4.1, available through the pyspark.pipelines module. The Databricks Runtime extends these open-source capabilities with additional APIs and integrations for managed production use.
Code written with the open source pipelines module runs without modification on Databricks. The following features are not part of Apache Spark:
dp.create_auto_cdc_flowdp.create_auto_cdc_from_snapshot_flow@dp.expect(...)
Pipeline reads and writes default to the catalog and schema specified during pipeline configuration. See Set the target catalog and schema.
Pipeline-specific Python code differs from other types of Python code in one critical way: Python pipeline code does not directly call the functions that perform data ingestion and transformation to create datasets. Instead, SDP interprets the decorator functions from the dp module in all source code files configured in a pipeline and builds a dataflow graph.
To avoid unexpected behavior when your pipeline runs, do not include code that might have side effects in your functions that define datasets. To learn more, see the Python reference.
Create a materialized view or streaming table with Python
Use @dp.table to create a streaming table from the results of a streaming read. Use @dp.materialized_view to create a materialized view from the results of a batch read.
By default, materialized view and streaming table names are inferred from function names. The following code example shows the basic syntax for creating a materialized view and streaming table:
Both functions reference the same table in the samples catalog and use the same decorator function. These examples highlight that the only difference in the basic syntax for materialized views and streaming tables is using spark.read versus spark.readStream.
Not all data sources support streaming reads. Some data sources should always be processed with streaming semantics.
from pyspark import pipelines as dp

@dp.materialized_view()
def basic_mv():
  return spark.read.table("samples.nyctaxi.trips")

@dp.table()
def basic_st():
  return spark.readStream.table("samples.nyctaxi.trips")
Optionally, you can specify the table name using the name argument in the @dp.table decorator. The following example demonstrates this pattern for a materialized view and streaming table:
from pyspark import pipelines as dp

@dp.materialized_view(name = "trips_mv")
def basic_mv():
  return spark.read.table("samples.nyctaxi.trips")

@dp.table(name = "trips_st")
def basic_st():
  return spark.readStream.table("samples.nyctaxi.trips")
Load data from object storage
Pipelines support loading data from all formats supported by Databricks. See Data format options.
These examples use data available under the /databricks-datasets automatically mounted to your workspace. Databricks recommends using volume paths or cloud URIs to reference data stored in cloud object storage. See What are Unity Catalog volumes?.
Databricks recommends using Auto Loader and streaming tables when configuring incremental ingestion workloads against data stored in cloud object storage. See What is Auto Loader?.
The following example creates a streaming table from JSON files using Auto Loader:
from pyspark import pipelines as dp

@dp.table()
def ingestion_st():
  return (spark.readStream
    .format("cloudFiles")
    .option("cloudFiles.format", "json")
    .load("/databricks-datasets/retail-org/sales_orders")
  )
The following example uses batch semantics to read a JSON directory and create a materialized view:
from pyspark import pipelines as dp

@dp.materialized_view()
def batch_mv():
  return spark.read.format("json").load("/databricks-datasets/retail-org/sales_orders")
Validate data with expectations
You can use expectations to set and enforce data quality constraints. See Manage data quality with pipeline expectations.
The following code uses @dp.expect_or_drop to define an expectation named valid_data that drops records that are null during data ingestion:
from pyspark import pipelines as dp

@dp.table()
@dp.expect_or_drop("valid_date", "order_datetime IS NOT NULL AND length(order_datetime) > 0")
def orders_valid():
  return (spark.readStream
    .format("cloudFiles")
    .option("cloudFiles.format", "json")
    .load("/databricks-datasets/retail-org/sales_orders")
  )
Query materialized views and streaming tables defined in your pipeline
The following example defines four datasets:
- A streaming table named
ordersthat loads JSON data. - A materialized view named
customersthat loads CSV data. - A materialized view named
customer_ordersthat joins records from theordersandcustomersdatasets, casts the order timestamp to a date, and selects thecustomer_id,order_number,state, andorder_datefields. - A materialized view named
daily_orders_by_statethat aggregates the daily count of orders for each state.
When querying views or tables in your pipeline, you can specify the catalog and schema directly, or you can use the defaults configured in your pipeline. In this example, the orders, customers, and customer_orders tables are written and read from the default catalog and schema configured for your pipeline.
Legacy publishing mode uses the LIVE schema to query other materialized views and streaming tables defined in your pipeline. In new pipelines, the LIVE schema syntax is silently ignored. See LIVE schema (legacy).
from pyspark import pipelines as dp
from pyspark.sql.functions import col

@dp.table()
@dp.expect_or_drop("valid_date", "order_datetime IS NOT NULL AND length(order_datetime) > 0")
def orders():
  return (spark.readStream
    .format("cloudFiles")
    .option("cloudFiles.format", "json")
    .load("/databricks-datasets/retail-org/sales_orders")
  )

@dp.materialized_view()
def customers():
    return spark.read.format("csv").option("header", True).load("/databricks-datasets/retail-org/customers")

@dp.materialized_view()
def customer_orders():
  return (spark.read.table("orders")
    .join(spark.read.table("customers"), "customer_id")
      .select("customer_id",
        "order_number",
        "state",
        col("order_datetime").cast("int").cast("timestamp").cast("date").alias("order_date"),
      )
  )

@dp.materialized_view()
def daily_orders_by_state():
    return (spark.read.table("customer_orders")
      .groupBy("state", "order_date")
      .count().withColumnRenamed("count", "order_count")
    )
Create tables in a for loop
You can use Python for loops to create multiple tables programmatically. This can be useful when you have many data sources or target datasets that vary by only a few parameters, resulting in less total code to maintain and less code redundancy.
The for loop evaluates logic in serial order, but once planning is complete for the datasets, the pipeline runs logic in parallel.
When using this pattern to define datasets, ensure that the list of values passed to the for loop is always additive. If a dataset previously defined in a pipeline is omitted from a future pipeline run, that dataset is dropped automatically from the target schema.
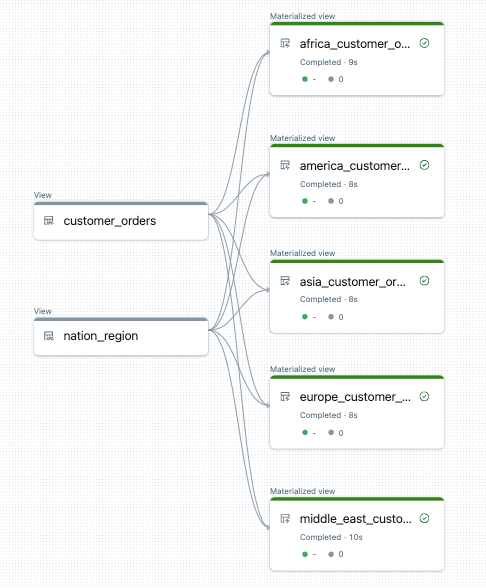
The following example creates five tables that filter customer orders by region. Here, the region name is used to set the name of the target materialized views and to filter the source data. Temporary views are used to define joins from the source tables used in constructing the final materialized views.
from pyspark import pipelines as dp
from pyspark.sql.functions import collect_list, col

@dp.temporary_view()
def customer_orders():
  orders = spark.read.table("samples.tpch.orders")
  customer = spark.read.table("samples.tpch.customer")

  return (orders.join(customer, orders.o_custkey == customer.c_custkey)
    .select(
      col("c_custkey").alias("custkey"),
      col("c_name").alias("name"),
      col("c_nationkey").alias("nationkey"),
      col("c_phone").alias("phone"),
      col("o_orderkey").alias("orderkey"),
      col("o_orderstatus").alias("orderstatus"),
      col("o_totalprice").alias("totalprice"),
      col("o_orderdate").alias("orderdate"))
  )

@dp.temporary_view()
def nation_region():
  nation = spark.read.table("samples.tpch.nation")
  region = spark.read.table("samples.tpch.region")

  return (nation.join(region, nation.n_regionkey == region.r_regionkey)
    .select(
      col("n_name").alias("nation"),
      col("r_name").alias("region"),
      col("n_nationkey").alias("nationkey")
    )
  )

# Extract region names from region table

region_list = spark.read.table("samples.tpch.region").select(collect_list("r_name")).collect()[0][0]

# Iterate through region names to create new region-specific materialized views

for region in region_list:

  @dp.materialized_view(name=f"{region.lower().replace(' ', '_')}_customer_orders")
  def regional_customer_orders(region_filter=region):

    customer_orders = spark.read.table("customer_orders")
    nation_region = spark.read.table("nation_region")

    return (customer_orders.join(nation_region, customer_orders.nationkey == nation_region.nationkey)
      .select(
        col("custkey"),
        col("name"),
        col("phone"),
        col("nation"),
        col("region"),
        col("orderkey"),
        col("orderstatus"),
        col("totalprice"),
        col("orderdate")
      ).filter(f"region = '{region_filter}'")
    )
The following is an example of the data flow graph for this pipeline:
Troubleshooting: for loop creates many tables with same values
The lazy execution model that pipelines use to evaluate Python code requires that your logic directly references individual values when the function decorated by @dp.materialized_view() is invoked.
The following example demonstrates two correct approaches to defining tables with a for loop. In both examples, each table name from the tables list is explicitly referenced within the function decorated by @dp.materialized_view().
from pyspark import pipelines as dp

# Create a parent function to set local variables

def create_table(table_name):
  @dp.materialized_view(name=table_name)
  def t():
    return spark.read.table(table_name)

tables = ["t1", "t2", "t3"]
for t_name in tables:
  create_table(t_name)

# Call `@dp.materialized_view()` within a for loop and pass values as variables

tables = ["t1", "t2", "t3"]
for t_name in tables:

  @dp.materialized_view(name=t_name)
  def create_table(table_name=t_name):
    return spark.read.table(table_name)
The following example does not reference values correctly. This example creates tables with distinct names, but all tables load data from the last value in the for loop:
from pyspark import pipelines as dp

# Don't do this!

tables = ["t1", "t2", "t3"]
for t_name in tables:

  @dp.materialized(name=t_name)
  def create_table():
    return spark.read.table(t_name)
Permanently delete records from a materialized view or streaming table
To permanently delete records from a materialized view or streaming table with deletion vectors enabled, such as for GDPR compliance, additional operations must be performed on the object's underlying Delta tables. To ensure the deletion of records from a materialized view, see Permanently delete records from a materialized view with deletion vectors enabled. To ensure the deletion of records from a streaming table, see Permanently delete records from a streaming table.