チュートリアル: Node.js Databricks アプリの開発
このチュートリアルでは、Databricks Apps で、 Chart.js と Express を使用して動的グラフを含む Web ページを提供する簡単な Node.js アプリを作成する方法について説明します。このアプリには以下が含まれます。
- グラフをレンダリングするスタイル付きのホームページ
- モック時系列売上データを返す API エンドポイント
- 環境変数を使用した動的ポート
前提 条件
このチュートリアルを完了する前に、次のことを行います。
- Databricks ワークスペースとローカル開発環境が正しく構成されていることを確認します。「 Databricks アプリのワークスペースと開発環境を設定する」を参照してください。
- Node.js コードのコンテナーとして機能するカスタム Databricks アプリを作成します。「カスタム Databricks アプリを作成する」を参照してください。
ステップ 1: 依存関係をインストールする
ターミナルを開き、次のコマンドを実行して次の操作を行います。
- Node.jsのインストール
- アプリのソースファイルと設定ファイル用のローカルディレクトリを作成します
- Express のインストール
Bash
brew install node
mkdir my-node-app
cd my-node-app
npm install express
ステップ 2: アプリのロジックを定義する
次の内容で app.js というファイルを作成します。
JavaScript
import express from 'express';
import path from 'path';
import { fileURLToPath } from 'url';

const app = express();
const port = process.env.PORT || 8000;

const __dirname = path.dirname(fileURLToPath(import.meta.url));
app.use('/static', express.static(path.join(__dirname, 'static')));

// Serve chart page
app.get('/', (req, res) => {
  res.sendFile(path.join(__dirname, 'static/index.html'));
});

// Serve mock time-series data
app.get('/data', (req, res) => {
  const now = Date.now();
  const data = Array.from({ length: 12 }, (_, i) => ({
    date: new Date(now - i * 86400000).toISOString().slice(0, 10),
    sales: Math.floor(Math.random() * 1000) + 100,
  })).reverse();
  res.json(data);
});

app.listen(port, () => {
  console.log(`🚀 App running at http://localhost:${port}`);
});
このコードは、次の処理を行う Express サーバーを作成します。
/staticディレクトリからHTMLページを提供します- モックセールスデータで
/dataに応答 PORT環境変数で定義されたポート(デフォルトでは8000)でリッスンします
ステップ 3: 静的 HTML ファイルを追加する
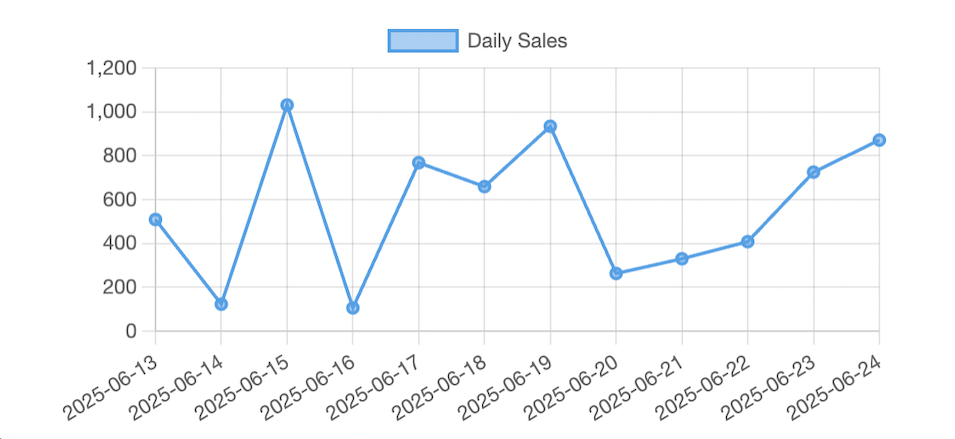
static/index.html でファイルを作成し、Chart.jsをロードして折れ線グラフをレンダリングします。グラフは、 /data API からモック データを自動的にフェッチし、ブラウザーにレンダリングします。
Html
<!DOCTYPE html>
<html>
  <head>
    <title>Sales Dashboard</title>
    <script src="https://cdn.jsdelivr.net/npm/chart.js"></script>
    <style>
      body {
        font-family: sans-serif;
        padding: 2rem;
      }
      canvas {
        max-width: 100%;
        height: 400px;
      }
    </style>
  </head>
  <body>
    <h1>📈 Sales Dashboard</h1>
    <canvas id="salesChart"></canvas>

    <script>
      async function renderChart() {
        const response = await fetch('/data');
        const data = await response.json();

        const ctx = document.getElementById('salesChart').getContext('2d');
        new Chart(ctx, {
          type: 'line',
          data: {
            labels: data.map((d) => d.date),
            datasets: [
              {
                label: 'Daily Sales',
                data: data.map((d) => d.sales),
                borderWidth: 2,
                fill: false,
              },
            ],
          },
          options: {
            responsive: true,
            scales: {
              y: {
                beginAtZero: true,
              },
            },
          },
        });
      }

      renderChart();
    </script>
  </body>
</html>
ステップ 4: 依存関係を定義する
パッケージを作成します。JSON Express を依存関係として宣言し、開始スクリプトを設定するファイルです。
JSON
{
  "name": "databricks-chart-app",
  "version": "1.0.0",
  "type": "module",
  "main": "app.js",
  "scripts": {
    "start": "node app.js"
  },
  "dependencies": {
    "express": "^4.19.2"
  }
}
ステップ 5: アプリをローカルで実行する
アプリをローカルでテストするには、次のコマンドを実行します。
Bash
npm install
npm run start
http://localhost:8000 に移動して、過去 12 日間の模擬売上データの動的グラフを表示します。
次のステップ
- アプリをデプロイします。「Databricks アプリのデプロイ」を参照してください。
- モック データを Unity Catalog または外部 API からのデータに置き換えます。
- 日付範囲や製品カテゴリなどのUIフィルターを追加します。
- Databricks シークレットまたは OAuth を使用してアプリをセキュリティで保護します。