Create visualizations with Databricks Assistant
When drafting an AI/BI dashboard, users can prompt the Databricks Assistant to build charts from any previously defined dashboard dataset. To create a new chart, start by asking what you want to learn from the data. You can also use the Assistant to edit a chart. After generating a chart, you can interact with and edit the generated visualization using the configuration panel. Users should always review visualizations generated by the Assistant to verify correctness.

How do I use a prompt to generate a visualization?
The following explains how to create visualizations using an existing dashboard where a dashboard dataset has already been defined. To learn how to create a new dashboard, see Create a dashboard.
-
Click
 Dashboards to open the dashboards listing page.
 -
Click a dashboard title to start editing.
-
Click the Data tab to see what dataset has been defined or used in the dashboard.
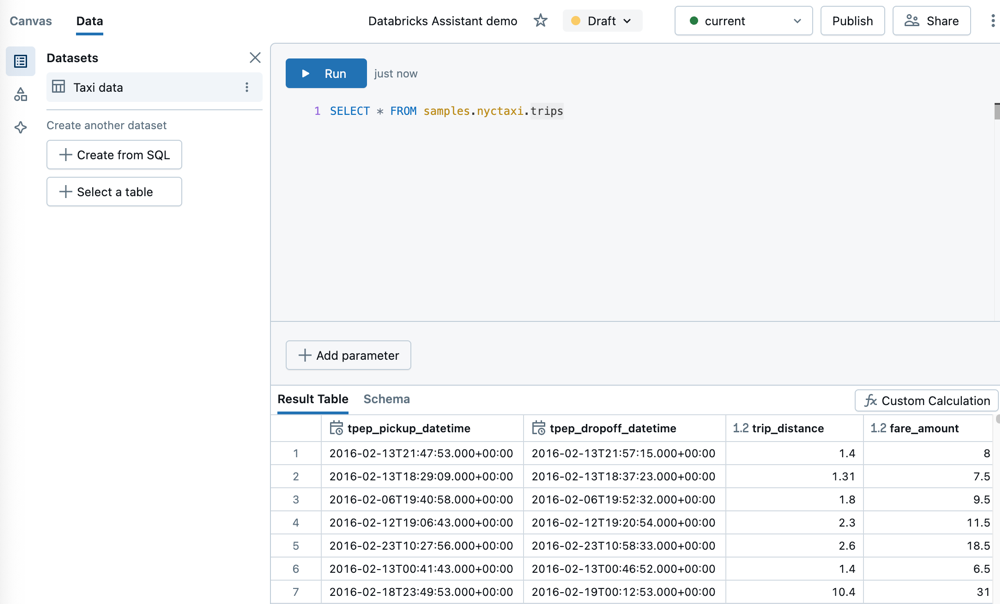
- To generate charts, at least one dataset must be identified in this section.
- If more than one dataset is specified, Databricks Assistant will attempt to find the best dataset to respond to the user's input.
-
Click the Canvas tab to go back to the dashboard canvas.
-
Create a visualization widget.
- Click
 Create a visualization to create a visualization widget and use your mouse to place it in the canvas.
- Click
-
Type a prompt into the visualization widget and press Enter.
- The Assistant can take a moment to generate a response. After it generates a chart, you can choose to Accept or Reject it.
- If the chart isn't what you want, retry the input using the
 Regenerate button.
 - You can also edit the input and then retry. The updated prompt modifies the previously generated chart.
noteIf you reject a modified chart, the chart and input are erased. You cannot revert back to the original suggestion.
-
You can edit the chart using either Databricks Assistant or the configuration panel. With your visualization widget selected:
- Click the
 Assistant icon to open the prompt input. Enter a new prompt to update your chart.
 - Use the configuration panel on the right side of the screen to update chart settings as you would for any dashboard visualization.
- Click the
Number of fields and input
You can compare up to three fields and answer inputs like:
- What were the average sales of my product?
- What were the average sales of my product per week?
- What were the average sales of my product per week by region?
Visualization types
Supported visualization types include area, bar, counter, line, pie, scatter, and table.
Tips for getting better results
- Be specific. Specify the chart type and necessary fields with as much detail as possible.
- Databricks Assistant has access only to table and column metadata and does not have access to row-level data. Thus, it might not create visualizations correctly if a question relies on the specific values in the data.
What is Databricks Assistant?
Databricks Assistant is an AI companion that enables users to be more efficient on the Databricks Platform. Visualization creation with Databricks Assistant is intended to help quickly answer questions about dashboard datasets. Its answers are based on table and column metadata. It declines to answer if it cannot find metadata related to the user question. AI models can make mistakes. Use the visualization editor to verify that the appropriate fields have been correctly selected.
Creating visualizations with the Databricks Assistant requires enabling Partner-powered AI features For details about Databricks AI-powered features, see Databricks AI assistive features. For questions about privacy and security, see Databricks AI assistive features trust and safety.