Troubleshoot compute issues
This article provides you with resources you can use in the event you need to troubleshoot compute behavior in your workspace. The topics in this article relate to compute start-up issues.
For other troubleshooting articles, see:
- Debugging with the Spark UI
- Diagnose cost and performance issues using the Spark UI
- Handling large queries in interactive workflows.
Use the Assistant to debug compute environment errors
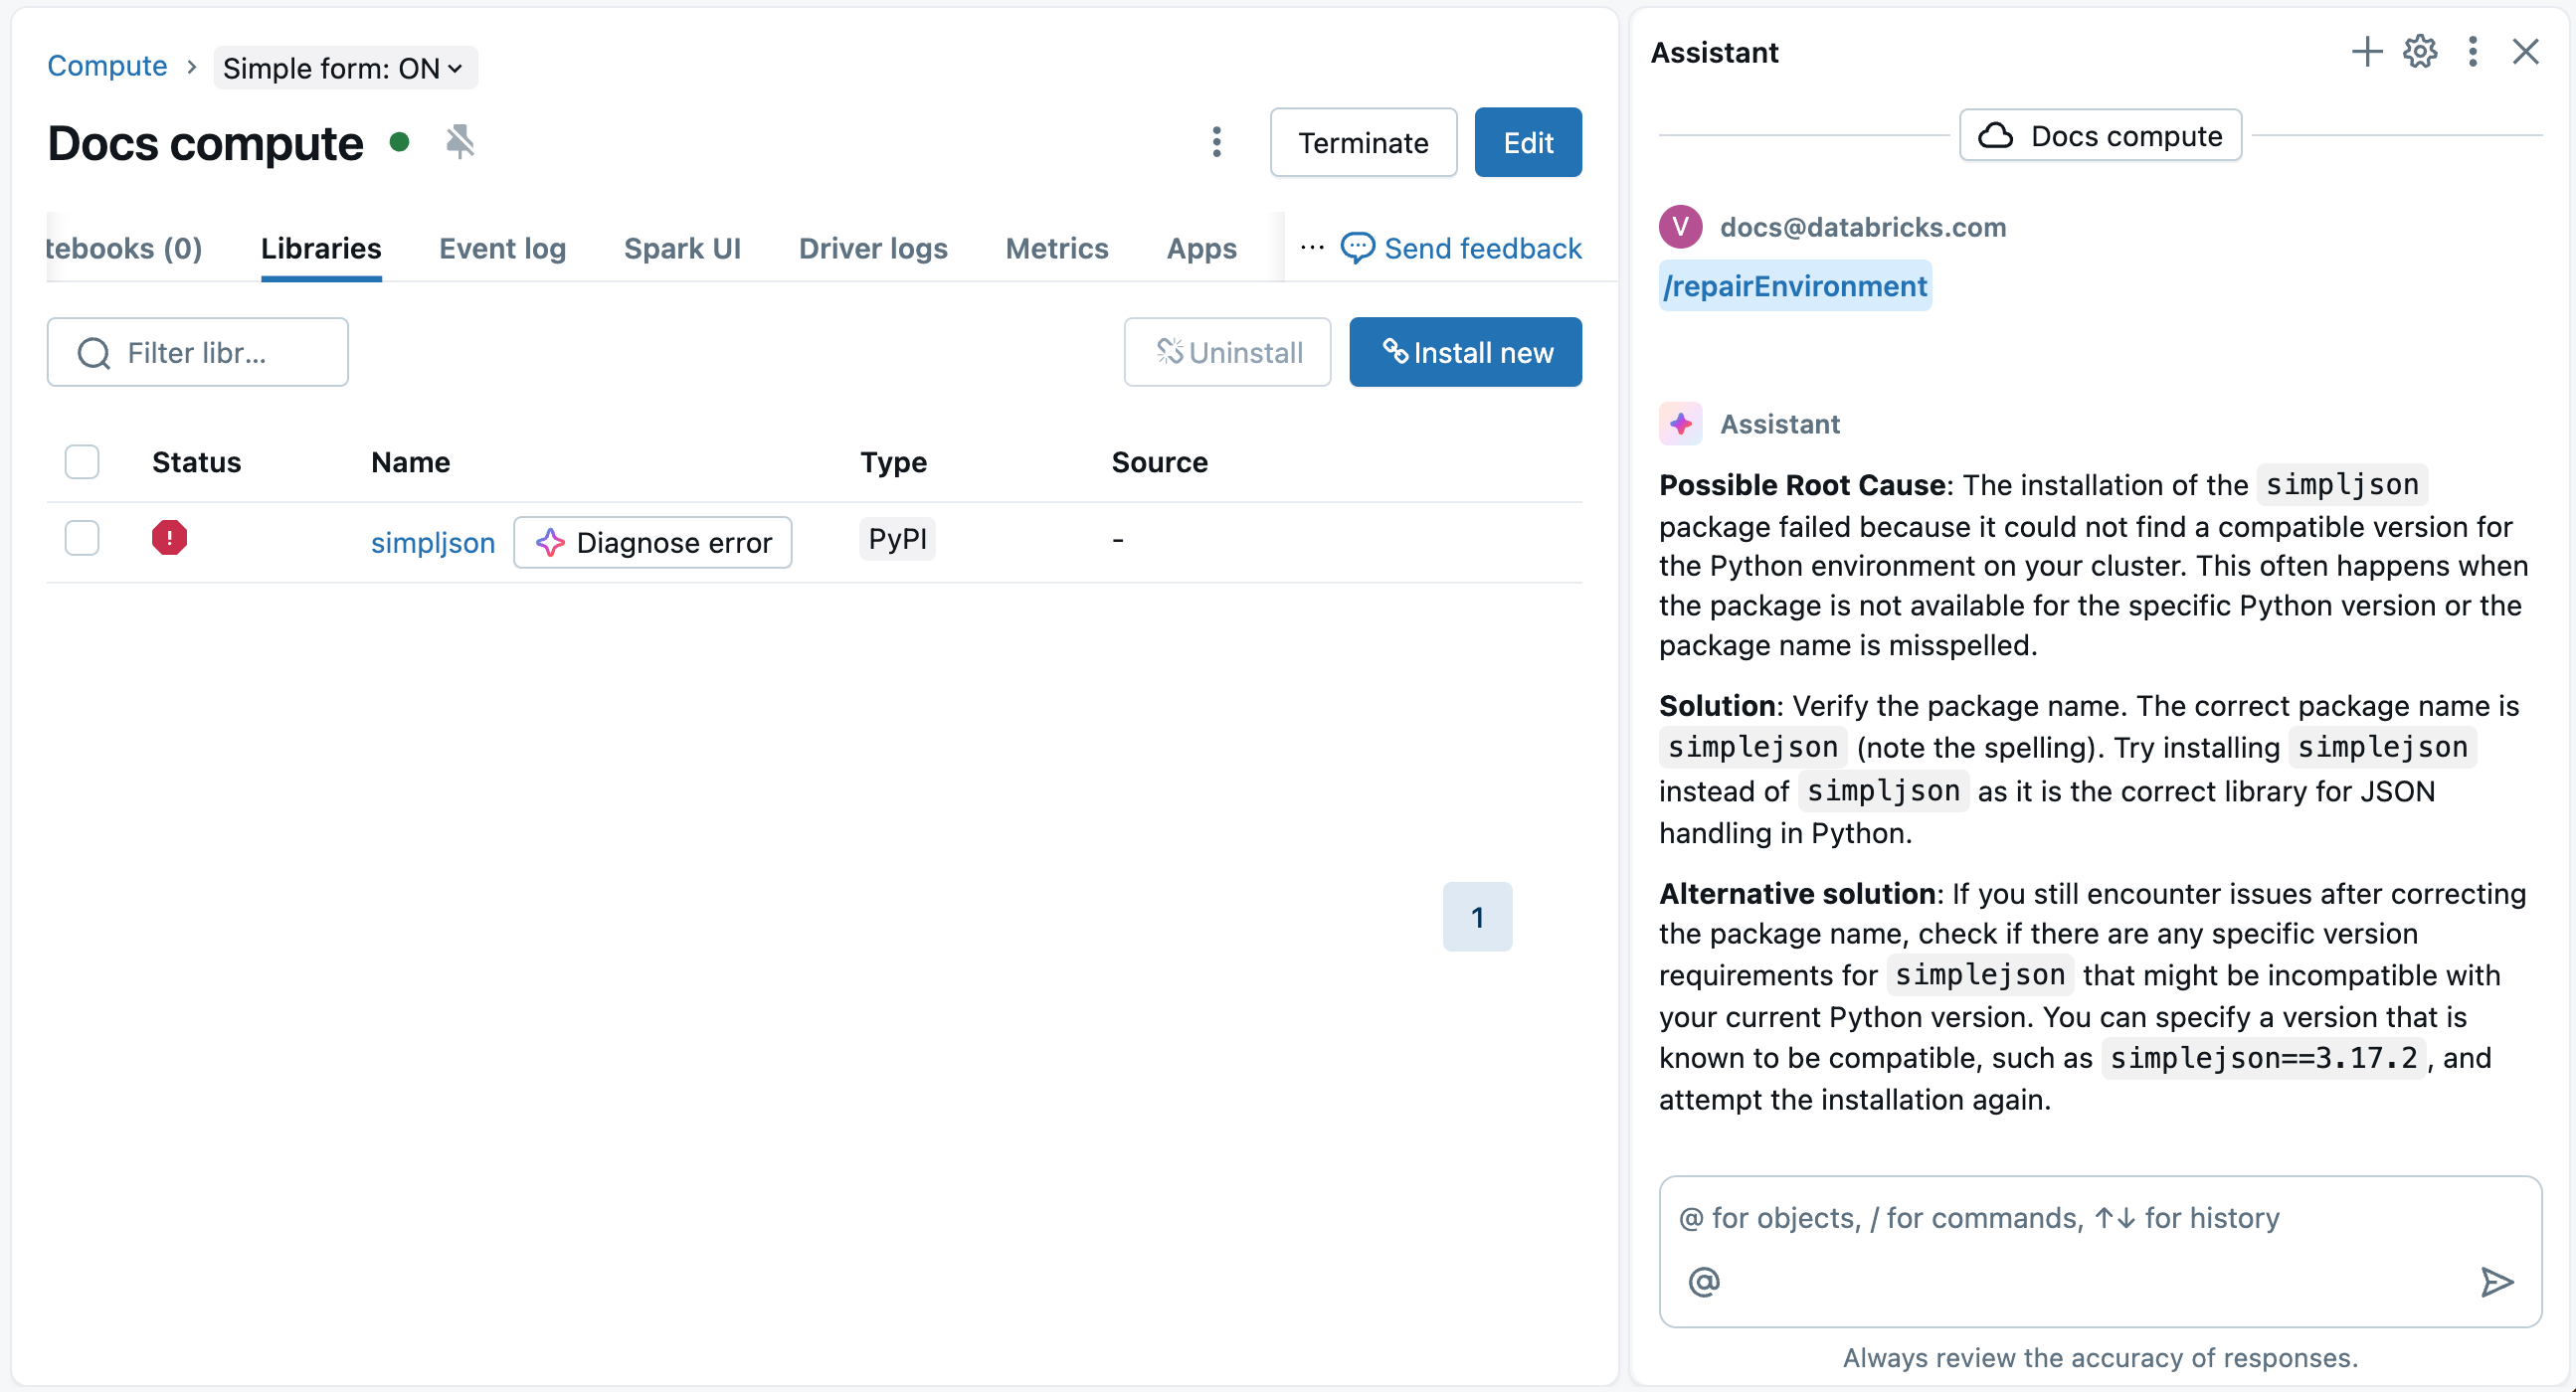
Databricks Assistant can help diagnose and suggest fixes for library installation errors.
On the compute's Libraries page, a ![]() Diagnose error button appears next to the failed package name and on the details modal that pops up when you click on the failed package. Click
Diagnose error button appears next to the failed package name and on the details modal that pops up when you click on the failed package. Click ![]() Diagnose error to use the Assistant to help you debug. The Assistant will diagnose the error and suggest possible solutions.
Diagnose error to use the Assistant to help you debug. The Assistant will diagnose the error and suggest possible solutions.
You can also use the Assistant to debug compute environment errors within a notebook. See Debug environment errors.
A new compute does not respond
After what seems like a successful workspace deployment, you might notice that your first test compute does not respond. After approximately 20-30 minutes, check your compute event log. You might see an error message similar to:
The compute plane network is misconfigured. Please verify that the network for your compute plane is configured correctly. Error message: Node daemon ping timeout in 600000 ms ...
This message indicates that the routing or the firewall is incorrect. Databricks requested EC2 instances for a new compute, but encountered a long time delay waiting for the EC2 instance to bootstrap and connect to the control plane. The compute manager terminates the instances and reports this error.
Your network configuration must allow compute node instances to successfully connect to the Databricks control plane. For a faster troubleshooting technique than using a compute, you can deploy an EC2 instance into one of the workspace subnets and do typical network troubleshooting steps like nc, ping, telnet, traceroute, etc. The Relay CNAME for each region is mentioned in the customer-managed VPC article. For the Artifact Storage, ensure that there's a successful networking path to S3.
For access domains and IPs by region, see IP addresses and domains for Databricks services and assets. For regional endpoints, see (Recommended) Configure regional endpoints. The following example uses the AWS region eu-west-1:
# Verify access to the web application
nc -zv ireland.cloud.databricks.com 443

# Verify access to the secure compute connectivity relay
nc -zv tunnel.eu-west-1.cloud.databricks.com 443

# Verify S3 global and regional access
nc -zv s3.amazonaws.com 443
nc -zv s3.eu-west-1.amazonaws.com 443

# Verify STS global and regional access
nc -zv sts.amazonaws.com 443
nc -zv sts.eu-west-1.amazonaws.com 443

# Verify regional Kinesis access
nc -zv kinesis.eu-west-1.amazonaws.com 443
If these all return correctly, the networking could be configured correctly but there could be another issue if you are using a firewall. The firewall may have deep packet inspection, SSL inspection, or something else that causes Databricks commands to fail. Using an EC2 instance in the Databricks subnet, try the following:
curl  -X GET -H 'Authorization: Bearer <token>' \
https://<workspace-name>.cloud.databricks.com/api/2.0/clusters/spark-versions
Replace <token> with your own personal access token and use the correct URL for your workspace. See the Token management API.
If this request fails, try the -k option with your request to remove SSL verification. If this works with the -k option, then the firewall is causing an issue with SSL certificates.
Look at the SSL certificates using the following and replace the domain name with the control plane web application domain for your region:
openssl s_client -showcerts -connect oregon.cloud.databricks.com:443
This command shows the return code and the Databricks certificates. If it returns an error, it's a sign that your firewall is misconfigured and must be fixed.
Note that SSL issues are not a networking layer issue. Viewing traffic at the firewall will not show these SSL issues. Looking at source and destination requests will work as expected.
Problems using your metastore or compute event log includes METASTORE_DOWN events
If your workspace seems to be up and you can set up compute, but you have METASTORE_DOWN events in your compute event logs, or if your metastore does not seem to work, confirm if you use a Web Application Firewall (WAF) like Squid proxy. Compute members must connect to several services that don't work over a WAF.
Compute start error: failed to launch Spark container on instance
You might see a compute log error such as:
Cluster start error: failed to launch spark container on instance ...
Exception: Could not add container for ... with address ....
Timed out with exception after 1 attempts
This compute log error is likely due to the instance not being able to use STS to get into the root S3 bucket. This usually happens when you are implementing exfiltration protection, using VPC endpoints to lock down communication, or adding a firewall.
To fix, do one of the following:
- Change the firewall to allow the global STS endpoint to pass (
sts.amazonaws.com) as documented in the VPC requirements docs. - Use a VPC endpoint to set up the regional endpoint.
To get more information about the error, call the decode-authorization-message AWS CLI command. For details, see the AWS article for decode-authorization-message. The command looks like:
aws sts decode-authorization-message --encoded-message
You may see this error if you set up a VPC endpoint (VPCE) with a different security group for the STS VPCE than the workspaces. You can either update the security groups to allow resources in each security group to talk to each other or put the STS VPCE in the same security group as the workspace subnets.
Compute nodes need to use STS to access the root S3 bucket using the customer S3 policy. A network path has to be available to the AWS STS service from Databricks compute nodes.