Dashboards
You can use dashboards to build data visualizations and share reports with your team. AI/BI dashboards feature AI-assisted authoring, an enhanced visualization library, and a streamlined configuration experience so that you can quickly transform data into sharable insights. When published, your dashboards can be shared with anyone registered to your Databricks account, even if they don't have access to the workspace. See Share a dashboard.
Databricks recommends using AI/BI dashboards (formerly Lakeview dashboards). Earlier versions of dashboards, previously referred to as Databricks SQL dashboards, are now called legacy dashboards.
End of support timeline:
- January 12, 2026: Legacy dashboards and APIs are no longer directly accessible. However, you can still convert them to AI/BI dashboards. The migration page is available until March 2, 2026.
Convert legacy dashboards using the migration tool or REST API. See Clone a legacy dashboard to an AI/BI dashboard for instructions on using the built-in migration tool. See Use Databricks APIs to manage dashboards for tutorials on creating and managing dashboards using the REST API.
AI/BI dashboards have the following components:
- Data: The Data tab allows users to define datasets for use in the dashboard. Datasets are bundled with dashboards when sharing, importing, or exporting them using the UI or API.
- Canvas: The Canvas tab can be organized into multi-page reports. Dashboard editors can build and configure their dashboards by adding widgets such as visualizations, filters, text, and images.
For information about the number of datasets, pages, and widgets each dashboard can hold, see Dashboard limits.
View and organize dashboards
You can access dashboards from the workspace browser along with other Databricks objects.
-
Click
 Workspace in the sidebar to view dashboards from the workspace browser. Dashboards are stored in the
 /Workspace/Users/<username>directory by default. Users can organize dashboards into folders in the workspace browser along with other Databricks objects. See Workspace browser. -
To view the dashboard listing page, click
 Dashboards in the sidebar.
By default, the dashboard listing page shows dashboards that you have access to sorted in reverse chronological order. You can filter the list by entering text into the search bar, filter by last modified within a time period, or filter by owner.
You can search across dashboard names, page names, widget titles and descriptions, and dataset names. When using the workspace search bar, you can also search within dataset queries.
-
Click a dashboard title to open it. If the dashboard has been published before, the published version opens. Otherwise, the draft dashboard opens.
Create a new dashboard
To create a new dashboard from the dashboard listing page, click Create near the upper-right corner of the page.
Delete a dashboard
To delete a dashboard:
- Open the draft dashboard.
- Click the
 kebab menu in the upper-right corner of the dashboard.
 - Click File actions > Move to trash.
Contents of the Trash folder are automatically deleted permanently after 30 days.
You can also organize and delete dashboards from their location in the workspace folder. See Delete an object.
Draft and collaborate on a dashboard
New dashboards open as drafts. Changes to a draft dashboard are saved automatically, but they do not automatically sync with the published version if it exists. For details about publishing dashboards, see Publish a dashboard.
To discard edits and restore the draft to the most recently published version, click the ![]() kebab menu in the upper-right corner of the dashboard, and click Discard changes.
kebab menu in the upper-right corner of the dashboard, and click Discard changes.
You can collaborate on a draft by sharing it with users in your workspace. Users with access interact with the dashboard using their own credentials. You cannot share draft dashboards with users outside the workspace. For more information about permission levels, see Dashboard ACLs.
Publish a dashboard
Publishing a dashboard creates a clean copy of the current draft. The publisher's compute credentials are embedded in the published dashboard and used to process all subsequent updates, regardless of which user or service initiates the update. You must have at least CAN EDIT permissions to publish a dashboard.
After publishing, the published version remains unchanged until you publish again, even if you make changes to the draft. You can make modifications and improvements to the draft version without affecting the published copy. Registered users with access can view the published version, and it continues to be emailed to subscribers if any exist. For more on managing dashboard access, see Share a dashboard.
Published dashboards are not versioned and should not be used for version control. You can revert a draft dashboard to the last published version. See Draft and collaborate on a dashboard.
When publishing, choose one of the following options:
- Share data permission (default): Viewers run queries using the publisher's data permissions. This allows users to view the dashboard even if they do not have direct access to the underlying data. This might expose data to users who have not been granted direct access to it. This is the default option.
- Individual data permission:
- Viewers run queries using their own credentials. Their data permissions determine what results they can see, and they must have access to the underlying data.
- Compute access is always granted by the publisher's credentials.
All dashboard viewers must authenticate to access the dashboard, regardless of the credential setting. To change the credential setting, republish the dashboard with your updated selection.
See Share a published dashboard for recommendations on which setting to choose.
To publish a dashboard, complete the following steps:
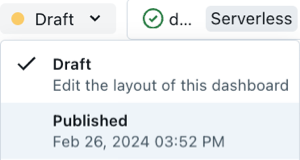
- Open a dashboard. If the dashboard has been published previously, the published version opens. If necessary, use the switcher at the top of the page to see the current draft version.
- Click Publish. The Publish dialog appears.
- Choose the credentials to use for the published dashboard. You can choose to share with data permissions or not.
- (Optional) Select Notify viewers if you want to send an email notification to dashboard viewers about the update. By default, this option is turned off to prevent unintended notifications.
- Click Publish. If your dashboard is being published for the first time, a Sharing dialog opens and prompts you to share the published dashboard. See Share a dashboard for details and recommendations on sharing.
To access the published dashboard, click Published in the drop-down menu near the top of the dashboard.
Use a service principal to publish and share dashboards
Use the REST API to publish and share dashboards with shared data permissions associated with a service principal. When users run API calls with the service principal's token, they access data under the service principal's permissions. This setup lets users who lack direct data or compute permissions view the dashboard and run queries, as long as they’re registered with your Databricks account.
To publish a dashboard with service principal credentials, you first authenticate as the service principal to obtain an OAuth access token, then use that token to call the dashboard publish API endpoint with embed_credentials set to true. The dashboard is published with the service principal's credentials embedded, allowing viewers to access the dashboard without requiring direct permissions to the underlying data or compute resources.
For step-by-step instructions and API examples, see Publish a dashboard with service principal credentials. For additional details about using the REST API to manage dashboards, see Lakeview in the REST API reference.
Download a published dashboard
After a published dashboard loads, use the following steps to download it as a PDF:
- Click the near the upper-right corner of the dashboard.
- Click Download as PDF.
Define your datasets
Use the Data tab to define the underlying datasets for your dashboard.
You can define datasets as any of the following:
- A new query against one or more tables or views.
- A Unity Catalog table or view.
When selecting tables or views in the asset selection dialog, you can hover over an asset to preview its schema and metadata, including the owner and last updated time. This helps you quickly identify the right data source for your dashboard.
Every dataset is defined by a query. For most tables and views, the default query for that dataset is a SELECT * statement on the table or view. You can modify the query to refine the dataset. For metric views, you cannot edit the view definition. You can, however, add custom calculations to visualize new measures and dimensions for the dashboard. See What are custom calculations?.
You can create multiple datasets by adding queries or selecting additional tables or views. To adjust the display order of datasets, drag and drop their names into the desired position.
All data returned by a dataset query is accessible to dashboard viewers, even if not all fields or rows appear in visualizations. To avoid exposing sensitive data, scope your SQL carefully. Use explicit column selection, WHERE clauses, and parameters to ensure only the intended data is included in the dataset. See Restrict dataset results using SQL.
To format a query in the dataset editor, right-click within the editor and select Format document. To customize how your SQL queries are formatted, see Custom format SQL statements.
For more details on creating and managing dashboard datasets, see Create and manage dashboard datasets.
Add pages, visualizations, text, and filters to the canvas
Use the Canvas tab to construct your dashboard. You can add visualizations, text, and filter widgets to each page. Use multiple pages to organize your content presentation, minimize scrolling, and improve dashboard readability. Use the toolbar at the bottom of each page to add widgets such as visualizations, text boxes, and filters.
Create multi-page reports
New dashboards start with a single page named Untitled page. To edit the name of a page, double-click the title and enter the new name into the text field. Naming conflicts resolve automatically by appending a number to the title. For information about page limits, see Dashboard limits.
To view the content on a page, click the title to select it.
Add and remove pages
To add a new page:
- Click
 to the right of the current page title on the canvas. By default, your new page is named Untitled page.
 - (Optional) Double-click the page title and enter a new name to rename the page.
To remove a page:
- Click the kebab menu to the right of the page title.
- Click Delete to delete the page.
Deleting a page also deletes all of the widgets on that page. If you delete all pages, click Create a page to start building your dashboard again.
Clone a page
To clone a page:
- Click the page title to select it.
- Click the in the title tile, then click Clone.
The new page is an exact copy of the original, including all widgets. The underlying datasets remain unchanged.

Copy pages across dashboards
You can copy a page from one dashboard and paste it into another dashboard.
To copy a page across dashboards:
- In the source dashboard, click the page name in the page tab bar to select it.
- Press
Command-C(Mac) orCtrl-C(Windows/Linux) to copy the page. - Navigate to the target dashboard and ensure it's in draft mode.
- Press
Command-V(Mac) orCtrl-V(Windows/Linux) to paste the page.
The pasted page includes all widgets from the original page. All datasets used by the page are created as new datasets in the target dashboard, ensuring the page functions independently.
Visualizations
Create a visualization by adding a visualization widget to a page on the canvas. Supported visualizations include area, bar, box, cohort, combo, counter, funnel, heatmap, histogram, line, pie, pivot, sankey, scatter, and table chart types. For a complete list of available visualization types and example configuration values, see AI/BI dashboard visualization types.
Queries used by visualizations do not always correspond precisely to the dataset. For example, if you apply aggregations to a visualization, the visualization shows the aggregated values.
To create a visualization, use one of the following methods:
- AI-assisted visualizations: Describe the chart you want to see in natural language and let Databricks Assistant generate a chart. After it is created, you can modify the generated chart using the configuration panel. You cannot use Assistant to create table or pivot table chart types.
- Use the configuration panel: Apply additional aggregations or time bins in the visualization configuration without modifying the dataset directly. You can choose a dataset, x-axis values, y-axis values, and colors.
For details about how to apply custom formatting to your charts, see Dashboard visualizations. See Table options to learn how to control data presentation in table visualizations.
When you apply temporal transformations in the visualization configuration, the date shown in the visualization represents the start of that period.
Generate a forecast
Use AI Forecast (Public Preview) to apply predictive forecasting to line charts to visualize future trends and patterns. Your line chart must have a temporal date field on the x-axis and a single numeric field on the y-axis.
To create a chart with AI forecast:
- With your line chart selected, click + in the Forecast section of the visualization editor.
- Click Clone with AI Forecast in the dialog that appears. A new line chart is created with forecasting applied.
To learn more about the function that generates the forecast, see ai_forecast function.

Troubleshooting visualizations
Editing a dataset can cause a previously configured visualization to display an error message. This can happen when dataset fields are removed or renamed. If your visualization shows an error, try the following actions:
- Refresh the dashboard.
- Click Show error on the visualization widget to view a detailed error message that might help identify issues in the dataset.
- Review the SQL used to generate the dataset associated with the visualization.
- Remove any broken filters that reference the dataset.
- Remove any other visualizations that use the dataset.
Text widgets
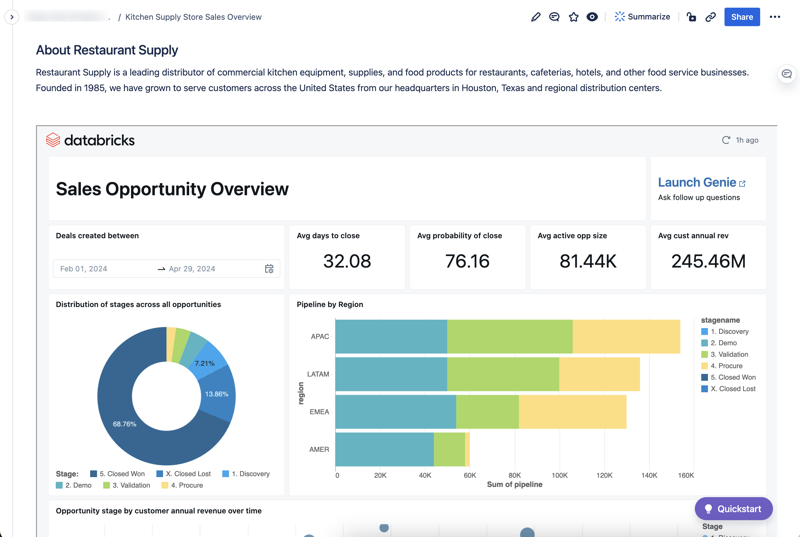
Text widgets let you add formatted text, links, and images to your dashboards. Drag a text widget onto the canvas and double-click it to start editing.
![]()
Use the formatting toolbar to style content in the following ways:
- Text styling: Adjust block style, font style, font size, and font color.
- Insert links: Click the link icon to open the link editor. Enter the URL and the link text to display in the widget.
- Insert images: Click the image icon to open the image editor. Enter a URL or path to your image and, optionally, alt text. See Image paths and URLs for supported paths and URLs.
You can also use markdown syntax to edit text. Click the kebab menu ![]() > Show markdown to view the text widget in markdown syntax. For details about basic markdown syntax, see the Markdown guide.
> Show markdown to view the text widget in markdown syntax. For details about basic markdown syntax, see the Markdown guide.
The following example demonstrates the formatting capabilities available in text widgets. You can copy this markdown and paste it into a text widget in your own dashboard to see the formatted output.
Markdown example
## Q1 2026 Sales Performance

### Overview

This quarter showed **strong growth** across all regions, with _total revenue_ exceeding targets by 15%. The `EMEA` region led with 22% growth year-over-year.

### Regional Performance

| Region        | Revenue | Growth | Status      |
| :------------ | :------ | :----- | :---------- |
| North America | $2.4M   | +12%   | ✅ On Track |
| EMEA          | $1.8M   | +22%   | ✅ On Track |
| APAC          | $1.2M   | +8%    | ⚠️ Monitor  |

### Key Highlights

- **Product launches**: Successfully launched 3 new features in March
- **Customer acquisition**: Added 450 new enterprise customers
- **Retention rate**: Maintained 95% customer retention
- **Market expansion**: Entered 2 new geographic markets

### Next Steps

Review the detailed breakdown in the [Sales Analysis Dashboard](#) and explore customer feedback in the [Customer Insights Report](#).

---

_Last updated: March 31, 2026_
This example demonstrates various formatting options including headings, styled text, tables, lists, and links. Customize the markdown to match your dashboard content. The formatted output appears in your dashboard as shown:
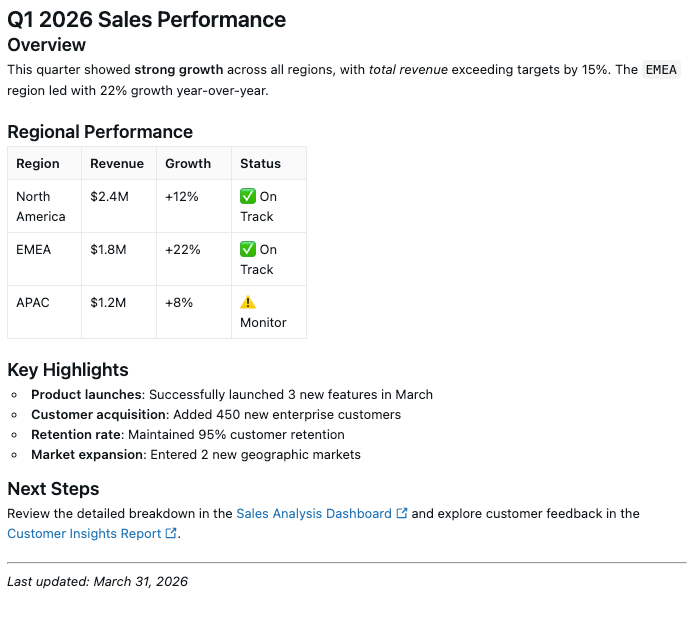
Image paths and URLs
Use one of the following methods to specify a URL or volume path for an image.
Use a Volume path
Use the following format, replacing the placeholders with your Databricks instance name and the path to the image in your Volume:
https://<databricks-instance>/ajax-api/2.0/fs/files/<Volumes/path/to/image>
Your instance name is in the first part of the URL that appears when you log in to your Databricks deployment. Some deployments include a workspace ID. Do not include the workspace ID when constructing the path. To learn more, see Workspace instance names, URLs, and IDs.
To find the Volume path:
- Click
 Catalog in the sidebar to open Catalog Explorer.
 - Click the image file in the schema browser.
- Click the kebab menu next to the file name, then click Copy Path.
See What are Unity Catalog volumes? to learn more about storing data in Volumes.
Regardless of whether your dashboard is published with shared or individual data permissions, you must explicitly grant access to users for image files stored on Databricks. Use Catalog Explorer to check, grant, and revoke permissions on the image files that you want to include. Click ![]() Catalog in the sidebar to open the Catalog Explorer UI.
Catalog in the sidebar to open the Catalog Explorer UI.
Use a publicly hosted image
For publicly hosted images, insert the public URL that points to the image.
Copy widgets
You can copy and paste widgets within a dashboard or between dashboards. After you create a new widget, you can edit it as you would any other widget.
To clone a widget on your draft dashboard canvas, complete the following steps:
- Right-click on a widget.
- Click Clone.
A clone of your widget appears below the original.
Remove widgets
Delete widgets by selecting a widget and pressing the delete key on your keyboard. Or, right-click on the widget. Then, click Delete.
Keyboard shortcuts
You can use the following keyboard shortcuts when editing dashboards:
Shortcut | Action |
|---|---|
| Undo an action on the canvas |
| Redo an action on the canvas |
| Copy a selected widget or page |
| Paste a widget or page into the current dashboard or a different dashboard |
| Delete a selected widget |
Download results
You can download datasets as CSV, TSV, or Excel files. You can download visualizations on the canvas as PNG files.
- To open download options from the Canvas tab, click the kebab menu in the upper-right corner of the widget.
- To open download options from a Data tab, click the kebab menu to the right of the dataset.
You can download up to approximately 1GB of results data in CSV and TSV format and up to 100,000 rows to an Excel file. The final file download size might be slightly more or less than 1GB, as the 1GB limit is applied to an earlier step than the final file download.
Use filters
Filters can be applied at a global level, at the page level, and at the widget level. They help dashboard viewers narrow down results and refine data in visualizations, similar to slicers in other BI tools. You can configure them to filter values based on one or more dataset columns (also referred to as fields) or parameters defined in the SQL queries that create datasets. For information about filter types, interactive filtering methods, and how to configure filters, see Use dashboard filters.
Customize dashboard appearance
You can customize your dashboard's theme, colors, fonts, and locale settings to match your organization's branding and regional preferences. These settings apply globally to all widgets and visualizations. See Dashboard settings.
Use dashboard tags
This feature is in Public Preview.
Use tags to organize and categorize dashboards for easier management. For more information about tags, see Apply tags to Unity Catalog securable objects. To learn how to view and manage tags on a dashboard, see Manage dashboard tags.
Enable a Genie space from your dashboard
This feature is in Public Preview.
When you create a dashboard, Databricks automatically creates a Genie space that allows business users to conduct self-serve data analytics using natural language. Publishing a Genie space associated with your dashboard allows viewers to explore dashboard data by asking their own questions for deeper analysis.
For more information about enabling, publishing, and managing Genie spaces associated with your dashboards, see Genie spaces with dashboards.
Genie can only access the data returned by the datasets in your dashboard. Viewers using Genie inherit access to the entire dataset query result, not just what is shown in visualizations. Define your datasets to include only the fields and rows that should be accessible.
Share a dashboard
You can securely share dashboards with anyone in your account. For users who are assigned to your workspace, you can grant access and set varying permission levels as you would with other workspace objects. For users who are not assigned to your workspace, you can share dashboards at the account level, allowing registered users to view and run your dashboard.
For details on how admins can set up your account for sharing at the account level, see AI/BI administration guide. For details on sharing your dashboard at the account and workspace levels, see Share a dashboard.
Dashboard account-level sharing supports email and one-time passcode authentication, and unified login with single sign-on (SSO). If a dashboard is shared when the recipient uses a one-time passcode login and then the account is later configured for SSO with unified login, account admins should verify dashboard recipients are allowed to access that Databricks account using their identity provider configuration. The users who aren't allowed to log in using SSO will no longer be able to access dashboards that were previously shared with them.
Embed dashboards in websites and applications
You can embed your published dashboard into external websites and applications using an iframe. See Embed a dashboard.
If you are a workspace admin who wants to manage the external sites where dashboards can be embedded, see Manage dashboard embedding.
Schedules and subscriptions
You can set up scheduled updates to automatically refresh your dashboard's cache and optionally send snapshots to email subscribers and Slack channels. Users with at least CAN EDIT permissions can create a schedule so that published dashboards with shared data permissions run periodically. Each dashboard can have up to ten schedules.
Subscribers receive dashboard snapshots according to the schedule frequency:
- Email subscribers: Receive a PDF snapshot via email
- Slack channels: Receive a PNG image snapshot visible directly in the channel, a direct link to open the dashboard in Databricks, and a PDF attachment in the message thread
For details on creating schedules and managing subscriptions, see Manage scheduled dashboard updates and subscriptions. To configure Slack notification destinations, see Configure Slack notifications.
Schedule updates using Lakeflow Jobs
You can configure a task to routinely update an existing published dashboard. To learn more about orchestrating workflows with Lakeflow Jobs, see Lakeflow Jobs. To learn how to configure a dashboard task, see Dashboard task for jobs.
Schedule and subscriber lists that you create using the dashboard UI or API are distinct from scheduling and automation associated with a job. See Automating jobs with schedules and triggers.
Export, import, or replace a dashboard
You can export and import dashboards as files to facilitate the sharing of editable dashboards across different workspaces. To transfer a dashboard to a different workspace, export it as a file and then import it into the new workspace. You can also replace dashboard files in place. That means that when you edit a dashboard file directly, you can upload that file to the original workspace and overwrite the existing file while maintaining existing sharing settings.
The following sections explain how to export and import dashboards in the UI. You can also use the Databricks API to import and export dashboards programmatically. See POST /api/2.0/workspace/import.
Export a dashboard file
To export a dashboard file:
- Open a draft dashboard.
- Click the kebab menu at the screen's upper-right corner.
- Click File actions > Export.
When the export succeeds, a .lvdash.json file is saved to your web browser's default download directory.
Import a dashboard file
- From the dashboards listing page, click
 > Import dashboard from file.
 - Click Choose file to open your local file dialog, then select the
.lvdash.jsonfile you want to import. - Click Import dashboard to confirm and create the dashboard.
The imported dashboard is saved to your user folder. If an imported dashboard with the same name already exists in that location, the conflict is automatically resolved by appending a number in parentheses to create a unique name.
Replace a dashboard from a file
To replace a dashboard from a file:
- Open a draft dashboard.
- Click the kebab menu at the screen's upper-right corner.
- Click File actions > Replace.
- Click Choose file to open the file dialog and select the
.lvdash.jsonfile to import. - Click Overwrite to overwrite the existing dashboard.
Edit a dashboard file
The serialized lvdash.json file that you have after exporting a dashboard includes complete query syntax and widget settings. In some cases, such as editing an automatically generated page or widget name value, it's useful to be able to edit this file directly.
To edit automatically generated values page and widget ID values:
- Export the draft dashboard and open the
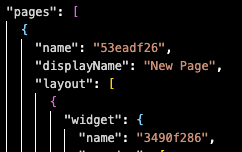
.lvdash.jsonfile in a text editor. - Edit the
namevalues associated with the page and widget. Save the file. - Import the file to your workspace and republish.
The name value in the JSON file is separate from the displayName field, which defines the page name shown in the UI.
Best practice for managing dashboard versions
Source control for dashboards is now in Public Preview. Workspace admins can control workspace access to the Public Preview from the Previews page. By default, the Support Dashboards in Git folder preview is On. See Version control dashboards with Git.
If you cannot enable the Public Preview, the recommended workflow is as follows:
- Export your dashboard as a JSON file. The file format is
lvdash.json. - Add that file to a version control system, such as Git.
- Edit the file. You can edit values in the text file directly or upload it back to your workspace and make changes in the UI.
- Save the new file. If you've made changes in the UI, export your new file. Use your version control system to track dashboard changes and versions.
- Update the existing dashboard. From the existing draft dashboard:
- Click the kebab menu in the upper-right corner and then click Replace dashboard.
- Click Choose file in the Replace dashboard from file dialog. Then, click Overwrite.
- Click the
Manage dashboards programmatically
See Use Databricks APIs to manage dashboards for tutorials that demonstrate how to use Databricks REST APIs to manage dashboards. The included tutorials explain how to convert legacy dashboards into Lakeview dashboards, and how to create, manage, and share them.
To learn how to manage an AI/BI dashboard using Databricks Asset Bundles, see dashboard. For an example bundle that defines a dashboard, see the bundle-examples GitHub repository.
Databricks also offers a Terraform provider. See the Databricks Terraform documentation.
Next steps
- Share dashboards with your team: Control access and set permission levels for dashboard collaboration. See Share a dashboard.
- Schedule automatic updates: Set up automated refresh schedules and email subscriptions for published dashboards. See Manage scheduled dashboard updates and subscriptions.
- Create datasets for dashboards: Build and manage the data sources that power your dashboard visualizations. See Create and manage dashboard datasets.
- Enable Genie spaces: Allow natural language data exploration by publishing Genie spaces with your dashboards. See Genie spaces with dashboards.
- Embed dashboards in applications: See Embed a dashboard.
- Automate dashboard workflows: Use Lakeflow Jobs to schedule and orchestrate dashboard updates. See Dashboard task for jobs.